Auto‑generate PowerPoint Slides From Google Analytics
Post and software updated: November 24, 2006
Chris Harrington, who lives here in Pittsburgh, wrote a post on the Web Analytics Forum on Friday, directing everyone to his GA-to-PPT tool. He directed everyone to his site where all the details are, but if you just want to use the tool, here’s how you do it. (And, I know all the details because Chris user tested it with me on Friday afternoon.)
Before I start, understand what the tool does. It merely takes the information you already have in Google Analytics and formats it nicely into a PowerPoint slide. You could definitely do the same thing yourself with a cut and paste job, but if you are generating a lot of these, it’s pretty handy. Plus, it formats the information to fit on the slide perfectly.
The URL is http://www.activeinterface.com/pptatk/ga2ppt.hta . But before you click, you should know that it only works in IE. If your computer is set to a different browser default, you need to cut and paste the URL into IE. You always have to choose Run (not save) because your computer will want to open it in your non-IE browser. (Anyone is welcome to tell me what the workaround for this is, as long is it doesn’t involve changing browser preferences…) Also, you should know that it only works if you have MSXML 4.0 SP2 Parser and SDK.
Once you get past the IE and MSXML thing, you can Run the tool and you’ll get a window like this:
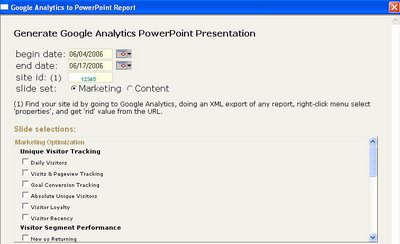
I’ve already filled in the first three fields but they’ll be blank, and you won’t yet have the report choices at the bottom of the screen. When I first looked at this, I didn’t really understand what he was looking for, but the date fields are just like the Google Analytics interface — you start by filling in the dates of the report you are interested in.
Next, you have to fill in the Site ID so that the tool knows which company you are tracking. Chris and I figured out that you don’t have to do any of that XML stuff to get the info — it merely wants the RID number that’s nestled inside each and every URL of your reports (and comes right after the question mark, like this: ?rid=123456&scid=something-else). Be sure to pick up just the six digit number and not the rid= or the scid information. Finally, choose a report area, marketing or content (Chris pointed out to me that he broke it down this way so that the user isn’t overwhelmed.) At that point, you’ll be able to select individual reports (which are identical to the ones you get in GA – remember, this is presentation, not analysis) and watch his magic.
Note: Chris and I worked together to update this software on November 24, 2006. As usual, Chris get the big applause and I was mostly nagging and testing. The updated version includes all the new reports that GA has rolled out in the past few months, like AdWords Analysis. In the newer version, the .ppt usually goes to your “My Documents” if you are a PC user (Mac users, please comment and tell us where it goes to.) The Excel version stays right on your desktop until you save it. Also, be patient when you see that black DOS screen come up — sometimes it takes as long as 60 seconds. If you’ve used this recently and not had success, be sure to clear your cache before trying again.
Every time I work with this, it is a great lesson not only in how to auto-generate GA slides but in the power of user testing.
Robbin Steif
LunaMetrics
News & Insights
Related Perspectives


