Measuring Your Keywords
As a search analyst, I’m often obsessed concerned with how many visits a website has received from search engine traffic. It’s one way to measure the success of an SEO project. Even better, I like to measure how many visits came from non-branded keywords (because those are the people who don’t already know you – new blood!).
But there’s one thing I want need to know and track on an ongoing basis that GA just doesn’t do. I need to see how many keywords send traffic and whether the number of keywords (NOK) is increasing or decreasing. Fortunately, GA does at least tell us how many keywords sent visits for a specified period, it just doesn’t let us see how that number changes over time.
Why are number of keywords important?
There are a couple reasons why I need to know whether the NOK sending traffic to a site is increasing or decreasing over time. Generally, it helps to measure progress during an SEO project. It’s one more indicator of success, especially if a main piece of the project involves creating content.
Indexation
If the NOK is increasing, that’s a good indication that the number of pages of the site being indexed and/or ranking highly is increasing. If you’re creating a lot of new content (blog posts, video, recipes, articles, etc.) it’s good to see if your efforts are paying off.
Of course, other factors can affect your NOK. Maybe you’ve changed your navigation menu or site architecture, or maybe you’ve been doing a good job of getting links to deep pages within your site. The effects of those endeavors will likely be seen in your NOK.
Early Alert
Monitoring your NOK also gives you a heads-up on site issues. If you see your NOK suddenly decrease, you can quickly look into any site changes that were made that may have caused a drop in rankings or indexation. No changes? Maybe your site’s been hacked (check Google Webmaster Tools for your site and Fetch as Googlebot).
Variety
Is your blog like a broken record? Do you keep talking about the same thing over and over again? Check your NOK – is it stagnant? Maybe you need to talk about something different, or at least from a different perspective. By introducing more variety to the content on your site or blog, you’ll be able to target different keywords. Even if your blog or site is very narrowly focused, I’m sure you can find some aspect of your niche that you haven’t discussed before.
How to Monitor Your NOK
Like I said before, GA doesn’t make it easy to monitor your NOK over time. To do that, you’ll have to do some manual labor in Excel. It’s nothing fancy – no macros or formulas involved – just some simple data entry and charts and graphs. Here’s a sample chart of what you can get, followed by the step-by-step instructions:

1. Open Excel and create a new spreadsheet. In the first column, label the first row “Date” and the second row “NOK” (or Number of Keywords, if that’s easier to remember).
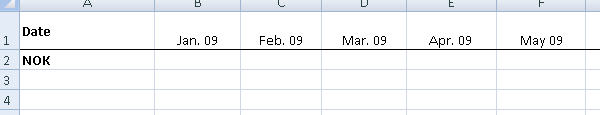
2. Determine how often you want to monitor your NOK. I recommend at least once a month, but if you are actively engaged in link building or if you’re making some significant site changes, you may want to check this more often. Of course, you can go back in your analytics data as far back as you have it, so in addition to keeping track of it moving forward, you can back fill previous months. At this point, you can fill in the specific dates in the columns of your spreadsheet.
3. Find in the numbers. The only thing left to fill in on our spreadsheet is the number of keywords that sent traffic for each month. This is easy enough to find in Google Analytics. Go to the Traffic Sources > Keywords report. Set the date range to the month (or week or day) you’re interested in, and you’ll find the NOK right beneath the graph, like below:

(click to enlarge)
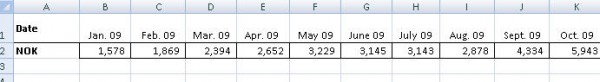
4. Fill in the numbers. Take the NOK from that report and enter it in your spreadsheet. Then wash, rinse and repeat. In a few minutes, your spreadsheet should look similar to this:
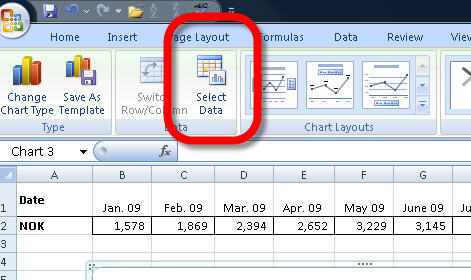
5. Create a chart. You’re almost done! Now all you have to do is create a chart based on that data, which is easy enough to do in Excel. From the “Insert” tab, click on Line chart:
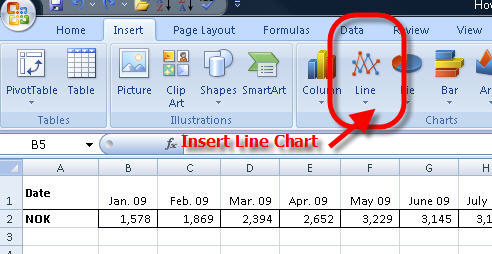
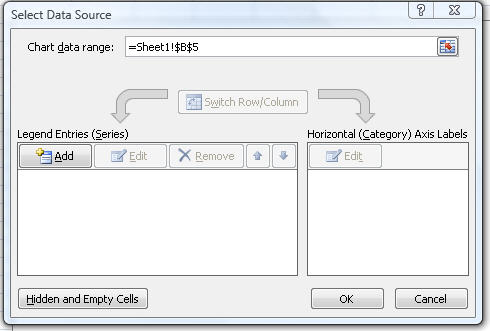
6. Select your chart data by clicking on Select Data. In the pop up menu, for “chart data range” just click on the cell with the first month’s number (1,578 in the example below) and drag to the last month’s number (or you can hold “shift” and click on the last number).
7. Fill in the details. You can pretty-up the chart by editing the labels for the horizontal axis and series name, and in no time, you have the chart that I showed you at the beginning.
Now, if someone could create a Firefox plugin or web app using the GA API that would do this automatically, I’d be a happy man. Any takers?
Do you measure keyword traffic? Tell us about it in the comments below!


