New Google Analytics Features: A Cheat Sheet
In case you haven’t been paying attention, it’s been a big week at Google. On Monday, the +1 button was released on all Google search pages. On Tuesday, the Google+ Project was announced. Then, on Wednesday, Google Analytics and Google Webmaster Tools got new social tracking features. So far, no big announcements for today, but it’s early yet.
If you’re like me, you feel like the world of Google is moving too fast to wrap your head around it all. That’s why I took the time to put together a cheat sheet of the recent additions to Google Analytics. At least for one of Google’s many products, you’ll know exactly what is available, what’s new, and what you should keep an eye on in the future.
| Date | Feature |
|---|---|
| March 2011 | Plot Rows |
| April 2011 | GA v5 Available to All |
| April 2011 | Multi-Channel Funnels Pilot |
| May 2011 | Site Speed Report |
| June 2011 | Webmaster Tools Integration |
| June 2011 | New Mobile Reports |
| June 2011 | Social Tracking |
Wow. That’s a lot of new stuff! Let’s go into detail.
Quick Over-Time Insights with Plot Rows
The first real treat of the year was the new Plot Rows feature, which we covered when it was announced.
If you were one of the lucky ones who had access to the new version of Google Analytics, you could mark off rows on a data table and see those segments displayed in your timeline. It is, hands down, the quickest way to gain on-the-fly insight into the performance of your traffic over time.
Try It Now: Go into Traffic Sources / Incoming Sources / Campaigns and plot two of your largest campaigns. Change the timeline to view the Bounce Rate. See any big peaks or valleys?
Of course, this feature was only available in the new version of Google Analytics. Thankfully, the next big feature announcement was…
Google Analytics v5 is Available to Everyone!
Yes, that’s right. After months of waiting for beta invites, Google opened the floodgates and gave everyone the opportunity to try out (and critique) the new version of Google Analytics. Redesigned from the ground up, v5 meant more useful features right away, but also an easier time with ugprades down the road. Based on the slew of new features in May and June, it looks like the plan worked.
Try It Now: One of my favorite features of the new version gets overlooked a lot, but I absolutely love how I don’t have to wait around for reports to load while I’m navigating through the sections. Click on Content or Conversions and the report sections open up immediately. In the old version, you couldn’t have more than one section open at a time. This saves me so much time every day.
Mixed Attribution with Multi-Channel Funnels
It’s not officially available, except in an extremely limited beta, but the announcement that Google was introducing a mixed attribution model into Google Analytics got a lot of people talking. Measuring assisted conversions and labeling traffic sources after-the-fact are two features that many users have been waiting on for a very long time.
Try It Now: Chances are you don’t have Multi-Channel Funnels at this point. As soon as it opens up to more people, look for a post on the LunaMetrics Blog.
Measuring Page Load Time with the Site Speed Report
One of the first new additions to v5 was the Site Speed report. With a minor addition to the Google Analytics Tracking Code, users could begin to see how quickly their content was loading for site visitors.
Try It Now: Pull your load time out of the Site Speed report and match it up against more interesting dimensions. Create a Custom Report that pairs browser, campaign, or location with the Average Page Load Time metric. See anything strange about those dimensions?
Integrate Google Analytics with Google Webmaster Tools
People have wanted a more fully featured SEO report set in Google Analytics for a while. Most of us use both GA and Google Webmaster Tools together, but now we can integrate the two and get search query information, clicks, impressions, and average organic position data right inside of Google Analytics. At the moment, this feature is still in a pilot program, so it hasn’t been rolled out to all accounts, but you can request an invite here.

Try It Now: If you’re lucky enough to be involved in the pilot, here’s a fun experiment to try. Pick a keyword that shows up in your Search Engine Optimization / Queries report and segment by landing page. Then modify your meta description for the top landing page and upload it. Monitor Google Analytics to see how the keyword’s CTR is affected. It’s a cheap and easy way to do A/B split testing on your organic results.
Improvements in Mobile Reporting
Based on anecdotal evidence (e.g., browsing the web on my Android phone) there are still a lot of site owners out there who aren’t convinced that mobile-designed websites are necessary. This may or may not be true, depending on the site, but you should be sure before making a decision either way. The updated Mobile report set shows precisely how many visitors are accessing your site from a mobile phone, and even shows you what model of phone is accessing your site. You can even see a picture of the device and find out how the user interfaces with the phone: touchscreen, clickwheel, or even stylus.

Try It Now: Before you do anything else, go to the Mobile Overview and change the report view to Percentage. What does the pie chart look like? What is the total percentage of visits to your site from mobile phones? If it’s small, it obviously means you don’t have a big share of mobile users. Do you need more, or is mobile browsing not something in your roadmap?
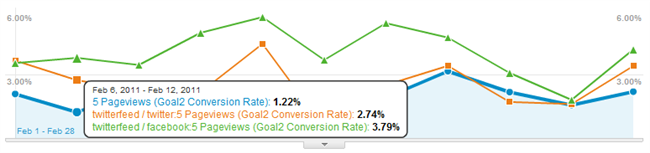
Social Tracking in Google Analytics
Tracking social media interaction on your website has been possible with Google Analytics, but up until now, it’s never had its own report set. Now, with the use of the new Google Analytics _trackSocial method on your site, you can start to track social interactions–Facebook likes, Twitter shares, and Google +1s–in the new Social report set.
Now, each time a visitor clicks one of those buttons, a special kind of event will be fired off and recorded by Google Analytics. You’ll be able to see the total amount of traffic that was “socially engaged” with your site and how it compares against the traffic that wasn’t. You can segment by the type of social actions and even see the specific pages that engaged visitors to click “Like” or “Share”.
Try It Now: By default, Google +1 clicks are tracked, so if you have a +1 button already installed on your site, you should already see some data in your Social report section. Take a look at the Social / Pages report and see what pages are getting +1’d. Is there anything special about them? As you think about ways to promote your content, keep an eye on this report and the Social / Engagement report to ensure that your social efforts are moving in the right direction.
What’s Next?
It’s obvious that the Google Analytics team isn’t sitting still. They’re bringing out new features and new reports at blazing speeds. What are you hoping is in the pipeline? Share in our comments!

