Creating Custom Limited‑Access Google Analytics Dashboards
Sometimes it’s important for certain people within an organization to have access to metrics within Google Analytics, but for whatever reason, they’re not allowed to have access to the whole shebang. Maybe ecommerce data is beyond their pay grade, or there’s sensitive data that they’re not privy to.
For whatever the reason, sometimes you have to restrict people’s access. Unfortunately, Google Analytics’ user access management leaves a little to be desired. You can either be an admin or a user. If you’re an admin, you have access to everything. If you’re a user, you can have limited access, but only by profiles. If you have access to a profile, you have access to every single report within that profile.
What if you wanted to restrict the type of data that a user had access to? Only give them a Pages report for a specific directory? Only grant them access to top level information about sources bringing traffic to the site?
Sure, you could create a bunch of profiles and try to uses some creative filters to ensure that only the right stuff gets into the filter and all the sensitive stuff gets blocked, but that can be extremely tricky, and downright impossible in some situations. If an employee needs to access some top-level sitewide metrics but not be able to drill down to certain others, you’re going to need a lot of different profiles.
Instead, I’ve found that creating custom limited-access dashboards with the Google Analytics Data Export API and a tool called Shufflepoint is straightforward and results in some pretty cool dashboards that can be installed on a static webpage or on a user’s iGoogle page.
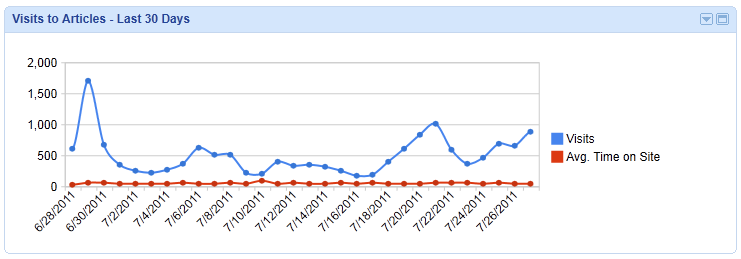
First of all, let’s talk a bit about Shufflepoint. What is it? It’s a “report integration hub” where you can pull data from multiple sources–in our case, Google Analytics–and then push it to other destinations. I can create a custom query to the Google Analytics Data Export API and then push the data retrieved from that query to the Google Charts API, to Google Maps, and even to an iGoogle Gadget.
Shufflepoint has an awesome drag-and-drop query tool that lets me pick the GA profile, metrics, and dimensions I want to pull, and then spits out a feed URI for the tool I want to import it into. Using the charts and table gadgets in the Google Chart Tools, I can just plug that URI into a field and it’ll spit out a graphic that shows up on my iGoogle page.
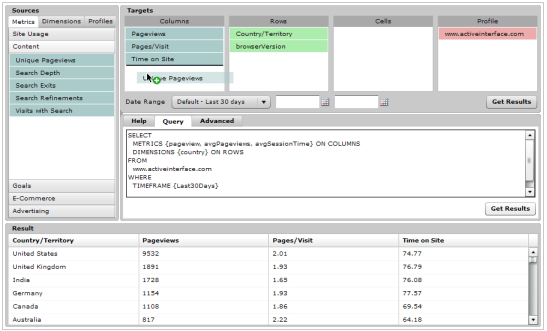
Now I can micro-manage the types of reports a user has access to. They don’t even need access to the Google Analytics interface. They just need an iGoogle page. For more information on signing up for Shufflepoint and using it with iGoogle gadgets, check out this page on the Shufflepoint site.
These are all pretty basic reports, though. What if the user needs to have something a little more fully-featured?
Using Shufflepoint, JavaScript and the Google Charts Tools, we were able to create a custom report that did just that. Take a look:
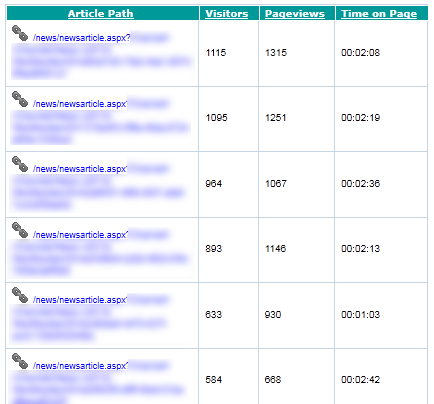
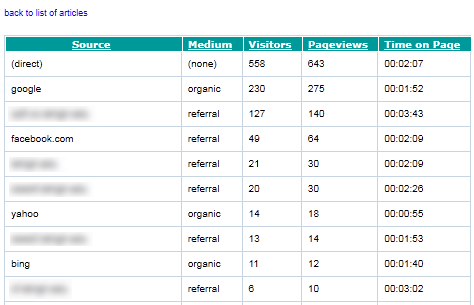
Right away, the gadget is pulling data from Google Analytics using Shufflepoint: the page path, the visitors, the pageviews, and the time on page. In addition, if the user clicks on the page path, it drills down and shows us the sources and mediums for visitors to that page:
Pretty cool, huh?
It’s not a common problem by any means. If you can, I highly recommend that you give analysts and stakeholders access to the Google Analytics interface. With new features being announced all the time, it’s the best, easiest place to go for sifting through your site’s data.
But if you have to restrict access, think about using the GA Data Export API and building some custom iGoogle Gadgets with Shufflepoint. You might be surprised with what you can accomplish!


