Monitoring Penguin Updates With Google Analytics

“You don’t want the next Penguin update,” according to Matt Cutts, head of Google’s webspam team. Those were his words less than a week ago at the keynote of the SES San Francisco conference.
Many SEOs and webmasters have been getting antsy over the impending update, which Cutts has said will be “jarring and jolting.” Although I won’t contribute to the millions of pixels that already dissect his statements, I will show you how to set up an early warning and monitoring station, using Google Analytics, of course.
How to use Google Analytics to monitor for Penguin updates
To monitor for updates from this flightless bird, we’ll be using 4 features of Google Analytics: 1) Custom Reports, 2) Dashboards, 3) Custom Segments and 4) Custom Alerts. Keep in mind, this will only let you know if you’ve been affected (positively or negatively) by Penguin. It won’t tell you when the Penguin update happened if it doesn’t affect your site.
1. Custom Reports
The standard way to check your organic traffic from Google in Google Analytics is this:
- Upon Logging into your account, you click Traffic Sources
- click Sources
- click Search
- click Organic
- choose Source as your Primary Dimension
- click google
- choose keyword as your secondary dimension
- use the advanced filter to exclude keyword exactly matching (not provided), click Apply
I don’t know about you, but that is far too many clicks and actions to get to data that I want to see on a regular basis. Fortunately, it’s easy to create a custom report that gives us the same data, but will only require two clicks to get to it.
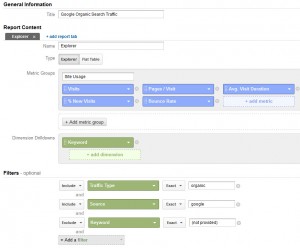
Custom Report #1: Google Organic Search Traffic

This report takes those eight steps above and gives it to you in two clicks. It shows you Google organic search traffic (excluding visits from users who are logged in to a Google account – those show up with (not provided) for the keyword).
It may also be helpful to see not just the overall visits from Google organic search, but to segment them by the number of words in the search queries. If Penguin targets specific keywords (as opposed to pages or sitewide adjustments) it may show up better this way.
Custom report #2: 1-Word Search Queries from Google
Custom report #3: 2-Word Search Queries from Google
Custom report #4: 3-5 Word Search Queries from Google
Custom report #5: 6-10 Word Search Queries from Google
Custom report #6: 11+ Word Search Queries from Google
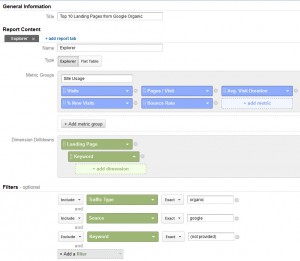
Also, here’s a report that will show your top 10 pages from Google organic. By clicking on the page in the report, it will drill down into the keywords that were used to get to that page.
Custom report #7: Top 10 Landing Pages from Google Organic

2. Dashboards
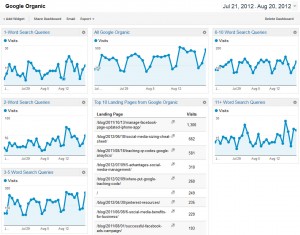
Now, once you have those custom reports in place, you can package them all together into a one-stop Google organic dashboard. You can check in here daily to see any fluctuations or unusual activity coming from the big G.

Here’s the dashboard, all ready for you to apply: Google Organic
3 & 4. Custom Segment & Custom Alerts
I know you’re busy. You don’t have time to check your analytics every single day, let alone obsess over every keyword. That’s where custom alerts come in.
Using a custom alert, you can be notified (by email or text message) whenever visits from Google organic decrease or increase by more than a given percent compared to the same day the previous week.
To do this, you’ll want to create custom advanced segments to match the custom reports above (include only Google organic visits, excluding (not provided) keyword). You could even go so far as to create a custom segment for each keyword length (I’ve done that for you below). This way, you’ll get an email if visits from Google organic where the searcher used between 3-5 words in their query decreases by more than 10%, for example.
Custom Segment #1: Google Organic Search Traffic
Custom Segment #2: 1-Word Search Queries (Google)
Custom Segment #3: 2-Word Search Queries (Google)
Custom Segment #4: 3-5 Word Search Queries (Google)
Custom Segment #5: 6-10 Word Search Queries (Google)
Custom Segment #6: 11+ Word Search Queries (Google)
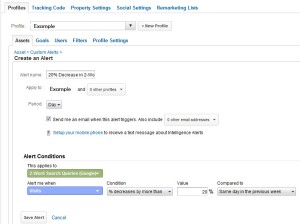
Once you have your custom segments, go to your Admin settings (click Admin in the top right of the orange navigation bar). In the Assets tab, click on Custom Alerts, then Create new alert. Give your alert a name (e.g. 20% decrease in 2-word queries), then choose the period to be Day. This will make the comparisons on a daily basis (instead of weekly or monthly) and will alert you to any changes almost immediately.
Select the check box to send an email when the alert triggers. This will send an email to the address you use to log in to Google Analytics. If that’s not one you check regularly, you can also supply additional email addresses to receive the alert. And if that’s not enough, you can even set up your phone to receive a text message with the alert.

Under the Alert Conditions, select one of your custom segments from above for This applies to. For Alert me when, choose Visits, for the condition, and choose % decreases by more than and set a value. You may want to start out with something small, like 10%, then gradually increase if you find you are getting too many alerts that don’t reflect any actual changes. For Compared to, you’ll want to choose Same day in the previous week.
Set up a custom alert for each custom segment, to alert you to both increases and decreases in visits, and you’ll be on top of any changes in organic traffic from Google. This is good to have regardless of Pandas, Penguins, or any other black and white animals.
Bonus: While you’re setting up these custom alerts, do yourself a favor and set up these additional alerts.