How To Access Custom Dimensions In Google Analytics
“Give it to me. NOW!”
– Veruca Salt, Willy Wonka and the Chocolate Factory
If you are using Universal Analytics you may have heard something about Custom Dimensions. They’re the next evolution of Custom Variables. Regular Google Analytics users get 20 of them, while Google Analytics Premium users get a whopping 200 of them.
I’m not going to cover here how to implement them. It’s pretty easy though. Here’s the Google Analytics documentation on the implementation.
What should you put in them? I’m not going to cover that in this post either but if you had trouble filing up 5 variables, then you might get overwhelmed by 20 or 200 dimensions. Here are some old ideas for custom variables. Most of those translate perfectly into Custom Dimensions.
What I AM going to cover is how to see these custom dimensions in your data. In the past few months we have talked to multiple people who implemented Custom Dimensions but couldn’t figure out how to see the data. I am fairly certain that at some point in the future we will see much better standard reports that let you access your custom dimensions. If Murphy’s Law works, then by writing this blog post, this possible new report will be announced and released within a week. Let’s call using Murphy’s Law to our advantage an ulterior motive for this post.
I want my Golden Goose… Now.
I look forward to the future comments by people saying “What do you mean? They are in the standard reports? You’re stupid!” who obviously have no reading comprehension or ability to see the timestamp on a post. THIS IS A TEMPORARY SOLUTION FUTURE DWELLER. I PRAY THIS IS WRONG IN YOUR FUTURE OF FLYING CARS AND TANG.
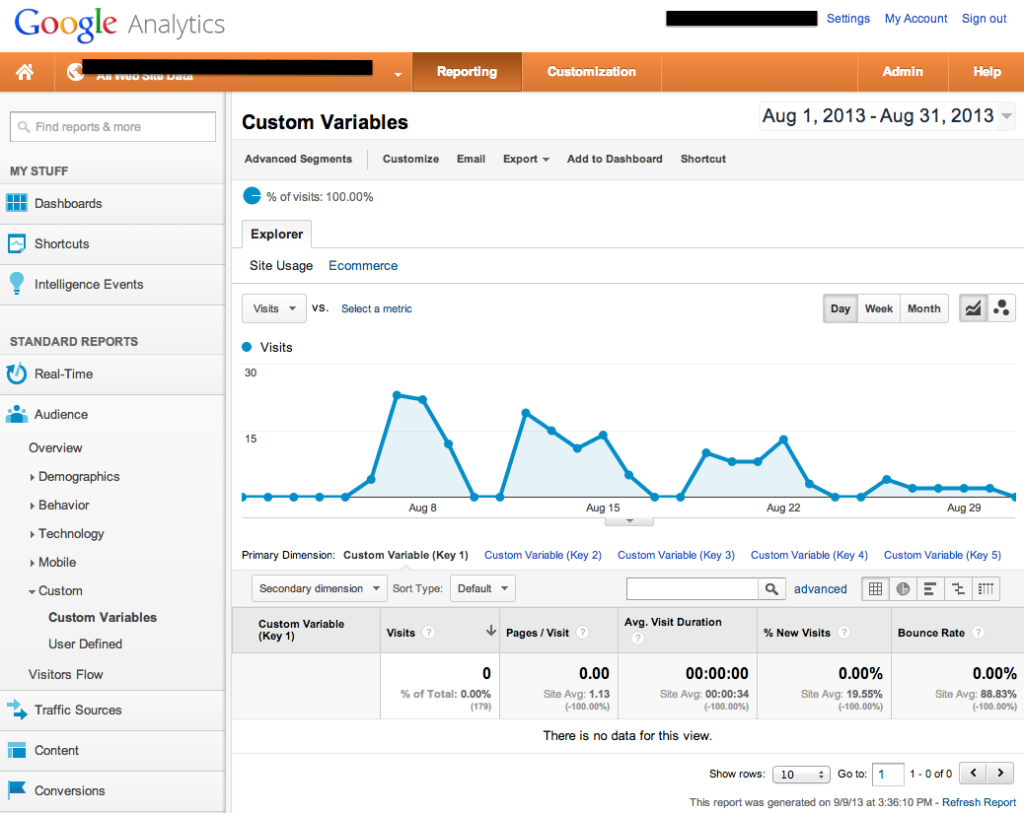
But if you want to see them TODAY you need to use either Custom Reports or Dashboards. If you look in the Custom section of the standard reports you will find but crickets.
Necessary Tangent: Loves Data, another GACP, did a great and some would say famous case study on Universal Analytics by tracking the use of their coffee machine in their office by using RFID keys to grab and track data that WASN’T web data. If you haven’t seen it, check the post and video out here: http://analytics.blogspot.com/2013/04/universal-analytics-business.html
Building off their coffee machine analogy we experimented tracking what our employees made with our own Latte Lounge, looking at not just consumption but WHAT drink they made. The Latte Lounge has many options. Regular coffee, flavored coffee, cappuccinos, lattes, mochas, even just hot water. We tracked the drink as a page view, and the options chosen as custom dimensions. We defined the various options our machine offered from bean, to the flavor and size, as well as the drinker.
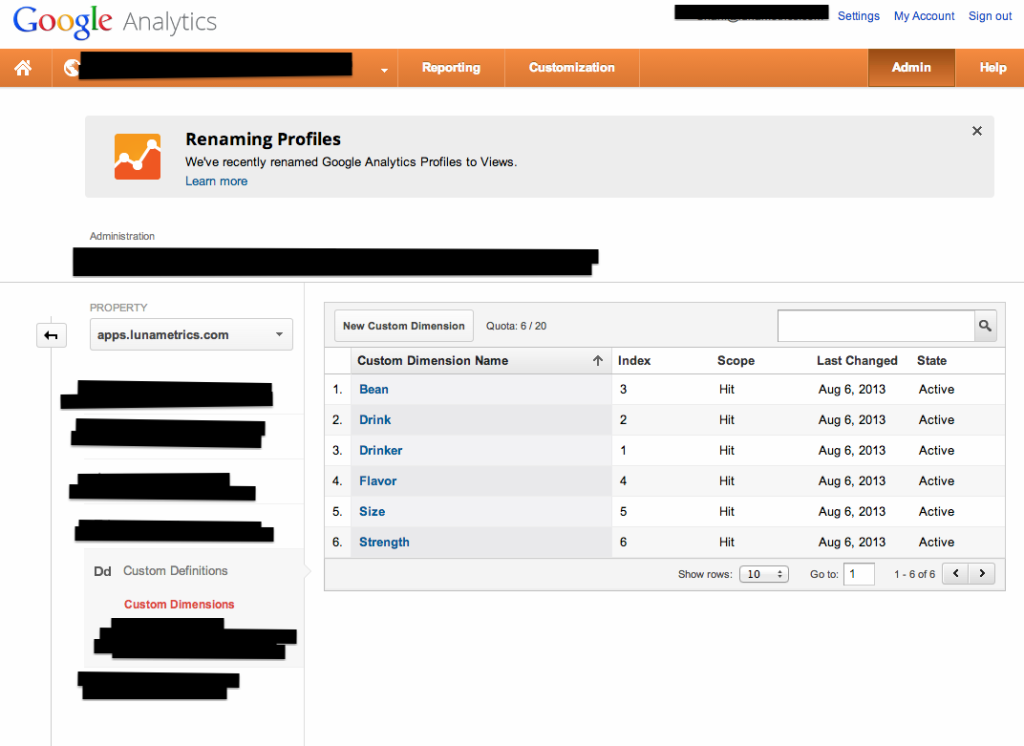
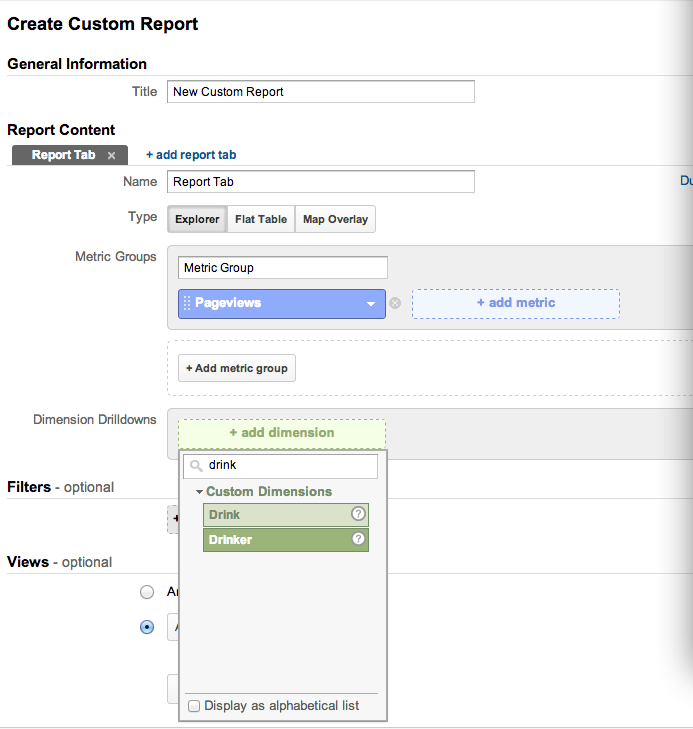
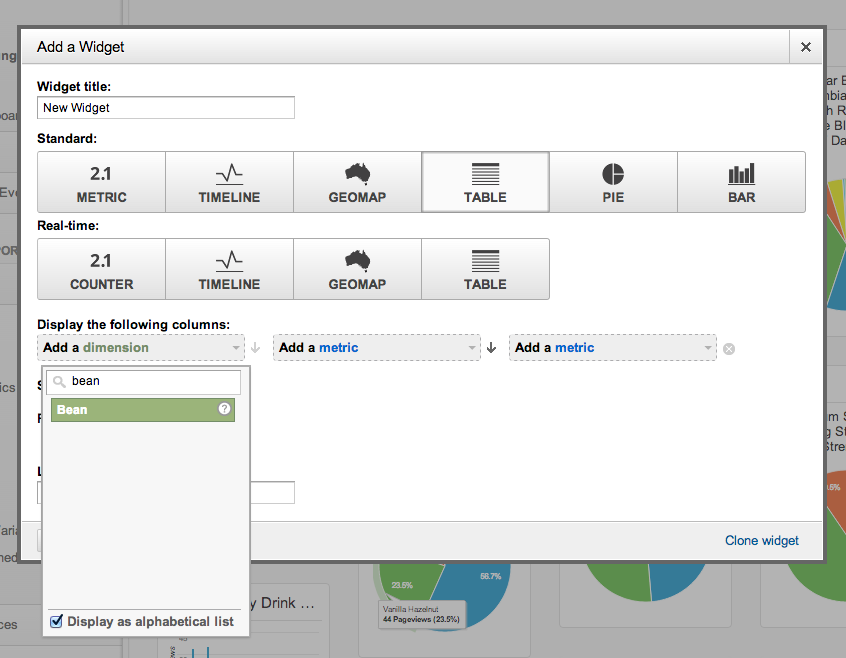
To put them into a Custom Report or Dashboard you need to know these names. Where custom variables have slots these are dimensions that you are defining, so you have to search for them by name. Like “Drink” or “Member Status”.
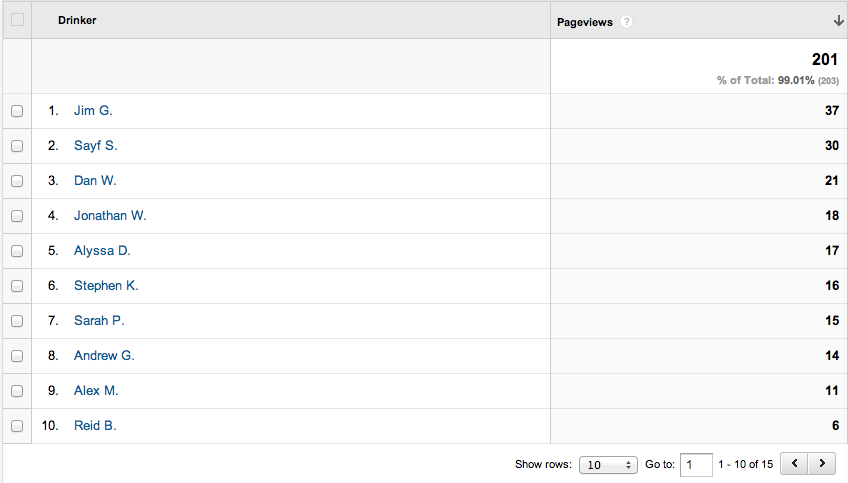
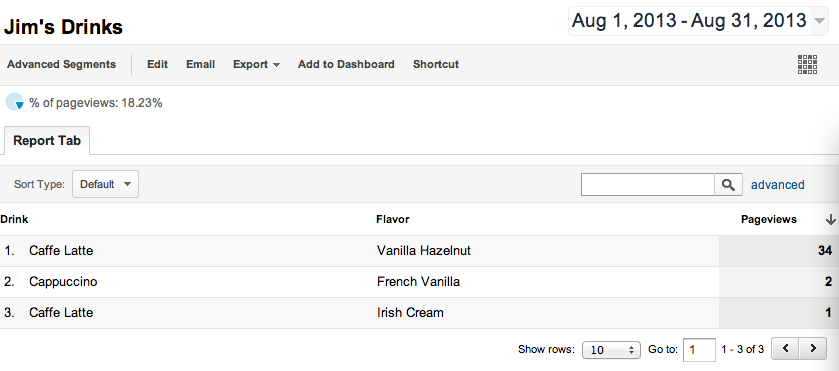
That lets us look at our custom dimensions relative to the metrics. So we can see that Jim Gianoglio drinks the most coffee in the office. Given that a few of my pageviews were actually test hits, he drinks more by a significant margin.
Or we can see that the Jim prefers to order Vanilla Hazelnut Cafe Latte’s.
In addition to Custom Reports they are available in Dashboards as well. Here’s a dashboard showing different breakdowns in what drinks people got, what beans they chose, what flavor choice they made.
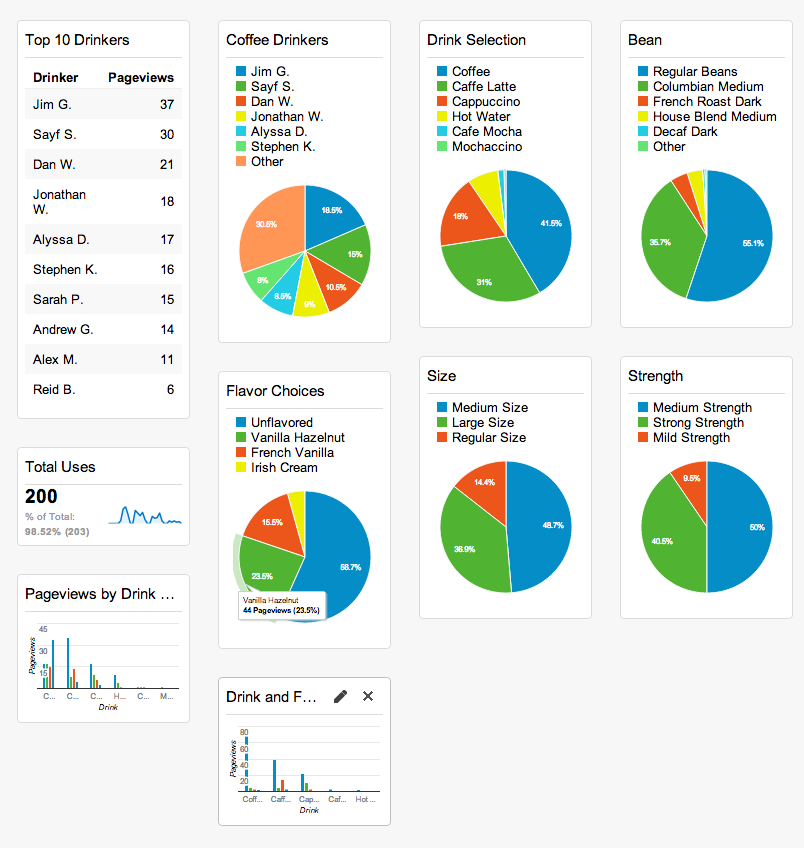
Interestingly the drink and flavor combination report showed that by far the most ordered drink in the office was a medium strength unflavored coffee. This is about the most boring flavor you can get from such a fancy machine. The second place drink? Vanilla Hazelnut Cafe Latte’s almost solely thanks to Jim.
Just like in Custom Reports you have to choose the dimensions by their assigned name, not their slot.
Hopefully this gives you some more encouragement to get to using your Custom Dimensions sooner rather than later. What data can you capture and put into Custom Dimensions on your website that you can combine into your own interesting reports and dashboards to gain insight? If we tracked a coffee machine for a couple of weeks and determined that it’s pretty much just Jim that is drinking all the vanilla hazelnut syrup, shouldn’t you be able to find some sort of more valuable insight in your own data?

Thanks again to Loves Data for the inspiration for our example. And to Jim for his consistent coffee order.
