Essential Guide To Testing AdWords Ad Copy – Part 2
In the last post, we went over how to set up your AdWords copy tests and reviewed common variables for testing. If you missed it, get caught up here.
Now, we’ll go over how to end your tests and measure your results.
When testing ad copy, we emphasize click-through-rate (CTR) over conversion rate. Ad copy is very important in capturing qualified traffic, but the ad’s primary job is to generate the click. Your landing page and site’s job is to get people to convert. Seeing an increase in the number of conversions with certain ad copy is definitely a positive, but realize there are other factors at play.
Additionally, CTR will help boost your Quality Score, which will hopefully boost future performance and lower your CPCs and cost per conversion.
Ending the Test
Before you decide to end your test, you need to ask three questions:
- Did the test run long enough to account for search variations and gather enough data?
- Do I have enough data to make a practical decision?
- Did I do anything that would have significantly influenced my results?
The first one is tricky. Paid search behavior can be fickle and often fluctuates throughout the week. Make sure you let your test go for at least a week to account for these.
Secondly, you need to let the test run long enough to get an adequate sample and for your results to be both statistically significant and practically useful. Take a look at the results from a test we are currently running:
Mathematically, my results are statistically significant. But ending my test here and making a decision based on a sample size of 81 impressions isn’t a good idea. Brad Geddes, founder of AdAlysis, suggests here that you should gather enough data such that one click won’t make a large difference in your data. Listen to him.
And finally, you need to consider if you made any changes that might mess with your results. For example, did you lower or raise bids during your test or add any extensions that might have altered your ad rank?
Since there are so many variables in paid search, running a test is tough. You don’t have to leave everything untouched, especially if your budget dictates that bids need to be lowered to prevent losses, just be aware of all the factors that might affect your results.
Picking a Winner
As I mentioned, we are looking for statistical significance when analyzing our results. I won’t go too much into the mathematical specifics, since I’m not a true statistician and because I don’t want to bore you.
However, I think we should go a bit more in depth than other posts I’ve seen and discuss the theory behind these kinds of hypothesis tests.
When you’re running a test like this, you are betting that there will be no difference between your control ad and your experimental ad, and that any observed difference in CTR is due to sampling error, or chance. This is called the null hypothesis.
To determine whether to reject or accept the null hypothesis, we need a significance level and a p-value. The significance level is chosen. It is the probability of us rejecting the null hypothesis when it’s actually true. In other words, it’s the probability that we will incorrectly conclude that there is a difference in our ads when there is none.
The p-value is the calculated probability of us obtaining results as extreme as the ones we received, assuming the null hypothesis is true (that there is truly no difference).
Traditionally, .05 is an acceptable significance level. Although .01 will lessen the likelihood of incorrectly rejecting the null hypothesis, it will also require more data. To determine if our results are significant, we compare our p-value to our significance level. If it is less than or equal to the significance level, we reject the null hypothesis.
Thankfully, there are plenty of online calculators that will do all of the math for you. We have a blog talking about the chi-squared test that might be helpful.
I personally use this tool from VMO, which has a .05 significance level . Your number of impressions will go in the “visitors” space and your clicks will go in the “conversions” space.
For example, if I wanted to measure the results of a test we just ran for a client, I would head into the interface and find my metrics and data:
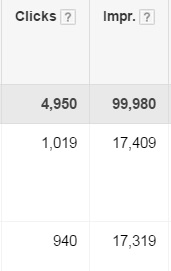
Our data in its natural habitat.
Then, plug it into the calculator:
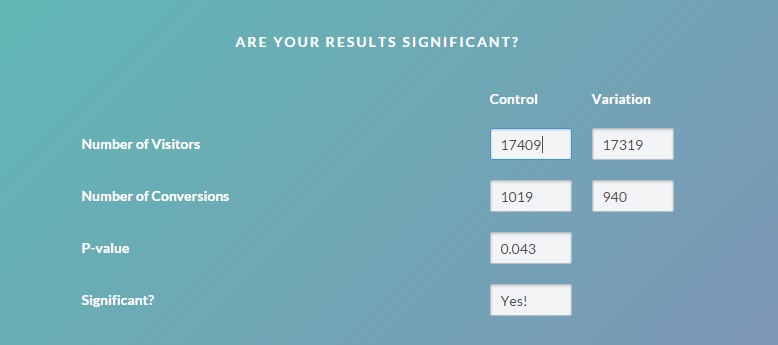
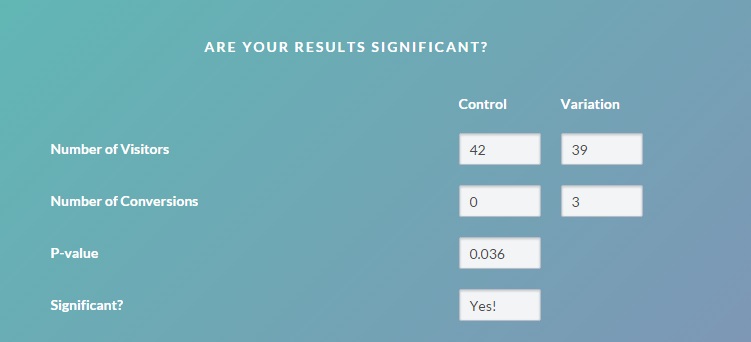
Impressions go into “Number of Visitors” and clicks go into “Number of Conversions”
And presto! From here, pick your winner (the control ad in this case) and move on to the next test.
It’s that easy.
Too Close to Call
…or is it?

You, when you’re writing killer ads, man.
What if you’ve hit your minimum data, but it’s too close to call? What if you’re such a baller at writing ads that they’re both killing it at an even pace?
Well, it can be a blessing and a curse. It’s great that you know your audience well enough to write two ads that are performing adequately, but you might be limiting yourself in finding copy that performs even better.
In this case, call it after a certain time period (90 days should do it) or pick an impression threshold and cut it off there. Once you end it, we recommend picking the copy that most closely matches the language on your website.
Then, get back out there and test!
A Note on AdWords Campaign Experiments
It is also possible to test ads, as well as account structure, ad groups, keywords, and bids through a feature called AdWords Campaign Experiments (ACE). You can only run one experiment per campaign at a time, but there are several (theoretical) advantages, as well as some drawbacks.
If you’re the type to set and forget, you can define the timeline of your experiment, and then select which version of your variable to keep after the end date.
Another benefit is the ability to set your test audience ratio. For example, if you have a well-performing ad group that you’re considering restructuring, you could make it so 70% of users see your control group and 30% see your experimental group. This will soften the blow to performance that can accompany testing.
ACE also simplifies results measurement by letting you know whether your results are significant or not. However, the reporting can be a bit confusing.
Although there are many cool features, I have not met many PPC professionals, if any, who use it on a regular basis. There is no shortage of blog posts singing ACE’s praises and claiming that the author “doesn’t use it nearly enough,” but I really haven’t found anyone who consistently utilizes ACE. It seems to perpetually be in beta and as mentioned above, the reporting can be a bit wonky. I myself prefer the simplicity of the old-school method.
Still, it does have pretty cool features, so if you do have something interesting in mind for a test, there really are a ton of possibilities. So please, test away!
