Custom Columns In AdWords: Tips And Tricks

The Google AdWords interface gives us several metrics we can deploy to measure success. Most people who come to our AdWords trainings have already heard of the standard ones: clicks, impressions, clickthrough rate, blah, blah, blah.
But one feature most people are surprised to learn about is the ability to create metrics using “custom columns.”
This underutilized feature allows us to create segmented metrics not available in the reporting interface so we can create a dashboard better suited to our needs and keep track of the things that matter in our accounts. Here are a few ideas to get you started:
Specific Conversions
One of my go-to categories when creating these are columns that isolate specific conversion actions. We have the ability to track several different conversions, which is awesome.
What’s not awesome is that it’s tough to drill down into specific conversions using segments. But we can remedy that with a custom column that only counts certain conversions.
Let’s say I’m an ecommerce retailer and my merchandising department wants to look at how many hats each campaign has sold. Since we have a separate conversion specifically tracking hat purchases, I’m going to create a set of custom columns that only looks at those actions.
To do this, head to Columns > Modify columns. At the bottom lives a bucket of metrics called Custom columns. This is where we’ll store all of our created columns.
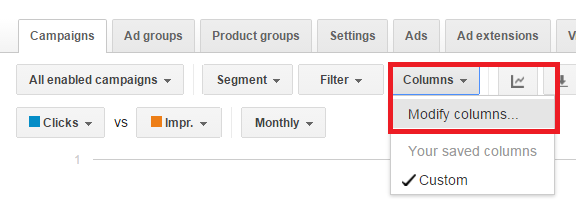
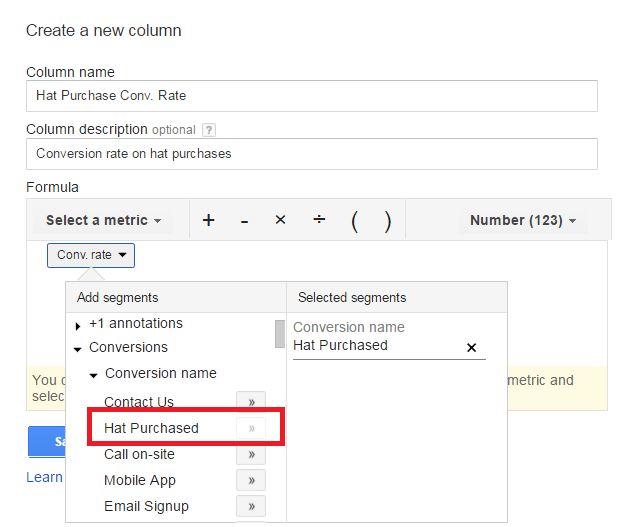
From there, click + COLUMN and create the hat column. Name it appropriately and leave a description for users who might not be familiar with the account.
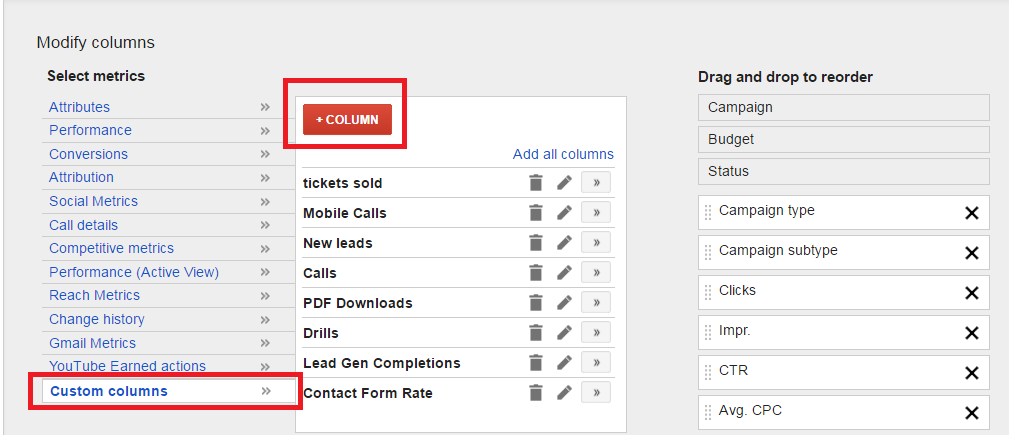
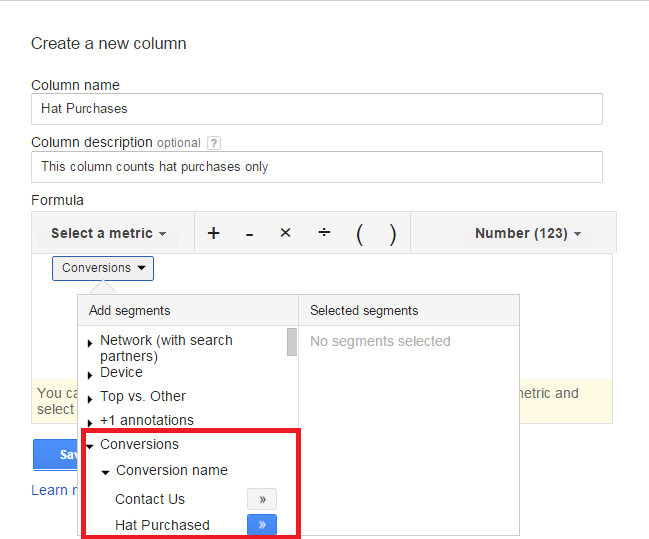
Select the conversion metric by clicking Select a metric and selecting Conversions.
Then, click the dropdown box and select Conversion name, and pick the conversion you want to track. In our example here, we have a column that only counts hat purchases.
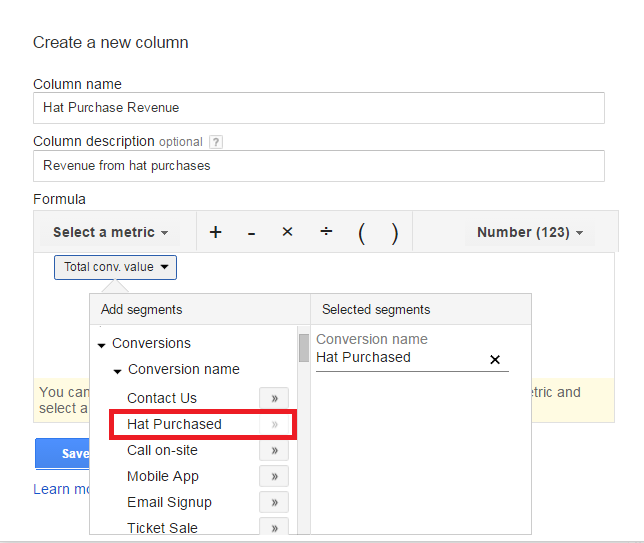
Now, let’s say the merchandising department wants to know how much revenue each campaign generated through hat purchases. Fortunately, we can create a custom column for that, assuming we have assigned a value to our conversion.
Follow the same steps to create a custom column and name it appropriately.
Under Select a metric, click Total Conv. Value. Then, click the drop down again and select Conversion name to choose which conversion you want to focus on. This column here represents the total value generated by hat purchases.
Finally, let’s assume the merchandising department asks to see each campaign’s conversion rates for hat purchases. For Select a metric, hit Conv. Rate and then use the dropdown to select your conversion name. This column now represents the conversion rate for hat purchases.
ROAS
Most people want to know how much money they’re getting back on the money they’re putting into AdWords.
And while we have a lot of different factors to consider when answering this question (are you importing goals from Google Analytics or using an AdWords conversion tag, what is your attribution model, etc.), there is no out-of-the-box metric to measure this.
So we’ll have to create our own metric to measure Return on Ad Spend. Or, ROAS for short.
In order for this to work, we’ll need to have a value attached to at least one of our conversions. The formula for ROAS is as follows:
Revenue / Ad Spend
With ROAS, we can see how much money we received from advertising versus how much we spent on advertising. However, you’ll notice this metric requires a calculation.
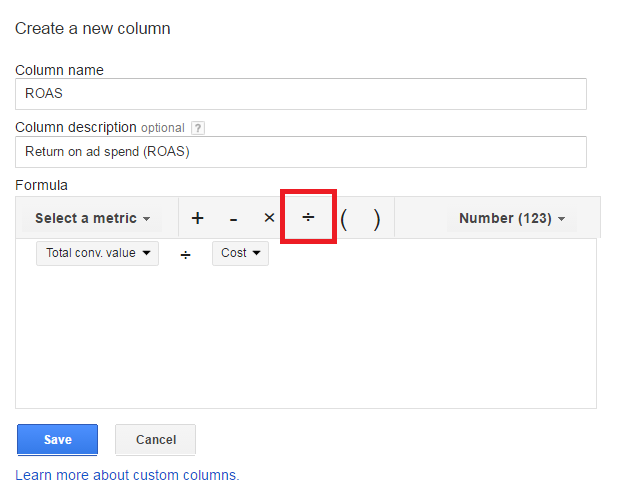
But fear not, since we have the ability to make custom columns do this math for us! Navigate to Select a metric, and click Total conv. value.
Then, hit the division symbol, and select another metric. This time, make it Cost. So now, our column should look like this, representing ROAS as:
Total conv. value / Cost
So for example, if I made $40,000 and spent $10,000, my ROAS is $4 ($40,000/$10,000), or 400% when expressed as a percentage (just multiply by 100). This allows you to comparatively assess which campaigns are the most effective in terms of return in your account.
One thing to note is that you might have certain conversions that contribute to the “Conv. value” metric, but that don’t actually produce revenue. For example, you might have given a form fill submission an arbitrary dollar amount for comparative purposes. Doublecheck your conversion settings to be sure.
Specific Devices
We now live in what Google calls the “mobile-first” world; one in which more searches occur on mobile devices than desktop computers. For many businesses, mobile is now a critical traffic segment.
For others, like industrial B2B services, it isn’t. Desktop still dominates.
Regardless of where your business falls on the spectrum, we can create custom columns that only look at the devices important to you, whether it’s desktops, mobile devices, or tablets.
These columns are similar to the ones for specific conversions. So, for example, we could see how many conversions from a mobile or desktop device each campaign drove, how frequently they converted, how frequently they clicked, or how much revenue they provided.
In the example below, we’re looking at conversion rates for users on mobile devices:
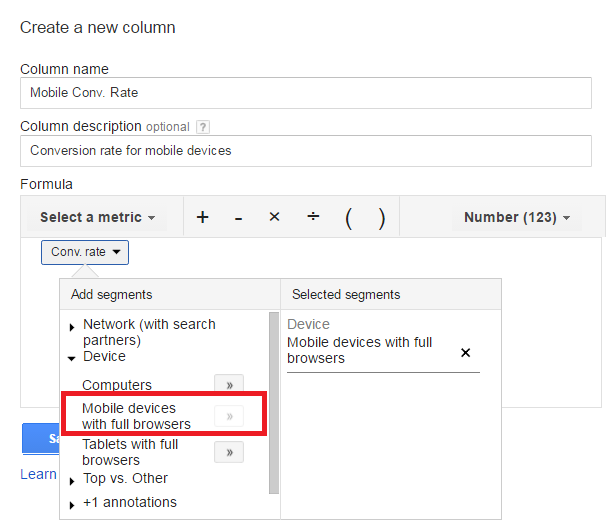
If we want to focus on mobile traffic and notice some campaigns have a low mobile conversion rate, we could:
- Review our landing page to make sure it’s mobile-friendly
- Use IF ads to customize ad copy based on device
- Test call-only ads
These kinds of columns are ones that I create almost immediately after either setting up or inheriting an account and help me drill down into metrics that are unique to the client.
Now, go forth, and be custom!


