Google Analytics For Firebase: A Reporting Introduction
As a mobile development platform, the Firebase SDK provides a lot of exciting opportunities for marketers, such as integrations with advertising tools like AdWords and AdMob, app personalization and cloud messaging, for example. However, it would certainly be helpful to cover the basics first. This post aims to provide a high-level overview of what is available in the Google Analytics for Firebase reports – I’ll touch on key definitions as well as the various reporting sections in the interface.
I’ll also mention some differences between Analytics reports in Firebase and the app views in Google Analytics for those of you who are familiar with the older Google Analytics SDKs for iOS and Android.
What Is It Called Again?
First, some clarification on the two tools: Google Analytics for Firebase (formerly just called Firebase Analytics) is the official name for the Analytics piece of the Firebase platform. Many (including myself) still sometimes call it Firebase Analytics, either by accident or because its just easier – but the correct name is Google Analytics for Firebase.
There are many organizations still using the v4 or even an earlier version of the Google Analytics SDK for tracking mobile app activity though. While the Google Analytics SDK has been deprecated and is now considered “legacy,” it is still supported and reporting can be done in mobile app Views in Google Analytics.
We will not be talking about the Google Analytics SDK here, apart from pointing out some key differences between it and the reports in Firebase.
The Demo Account
Many of the example screen shots you’ll see in this post come from the public Firebase demo account, which you can access here:
I recommend that you check that out and follow along.
Report Tools in Google Analytics for Firebase
Before we jump into the various reporting sections, here are a few important details to note regarding the dimensions and metrics you’ll find throughout the interface and some of the report tools.
Key Definitions
I’m not going to list out all of the dimensions and metrics you’ll find in the Analytics reports, but I wanted to call out a handful of the ones that I feel are very important below. To make it more fun, I also noted a few additional opportunities with some of the features in Firebase.
User
An individual user (or more accurately, device) accessing your app. Based on the Android Advertising ID on Android and Advertising Identifier on iOS.
These device identifiers can be reset by the user, though I would guess that this happens rarely in comparison to web users resetting their cookies.
Note that if your iOS app does not have access to the Advertising Identifier on a user’s device, you will not be able to collect interests and demographic data in Firebase as the Vendor ID will be used instead.
Session
A period of time where the user was “engaged” with your app – meaning they had it open in the foreground for at least 10 seconds. A session times out after 30 minutes of inactivity – in Firebase terms, this means the app is no longer in the foreground (it was hidden in the background or closed altogether). These are the default configurations for a session, and they can be adjusted. For example, you may wish to shorten the minimum engagement time required for a session to be initiated.
Note that this is different than the legacy GA SDK – which defined sessions based on grouping hits received within 30 minutes of each other.
Additionally, unlike mobile and web views in Google Analytics, Firebase places far more emphasis on users than sessions – you won’t see sessions nearly as often in Firebase reports.
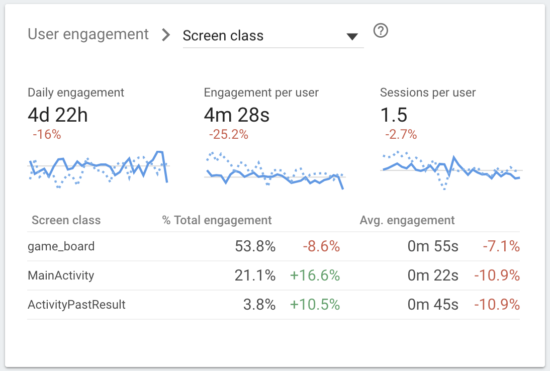
User Engagement
Firebase automatically emits “user_engagement” events periodically while an app is in the foreground, which results in User Engagement metrics per screen in the Dashboard of Google Analytics for Firebase.
Events
Interactions within the app that are being tracked via event logging for Firebase. In addition to certain activities that are captured automatically, you can also log custom events in your app for various features or actions that you want to track.
These are similar to Google Analytics event tracking for web and mobile views – though the schema is different. There are no dedicated event category, action and label parameters – instead, you log an event by name and then optionally attach up to 25 additional parameters in order to capture additional context about the action that occurred. With the limit of 25 additional parameters, Firebase events are more flexible than Google Analytics event tracking for mobile and web views.
Firebase offers suggested events and parameters as examples – you can read more about those here:
It is advised that you utilize suggested events and parameters where it makes sense in your app as new features and reports in Firebase are likely to be built upon them in the future.
There is no limit to the number of events you can log, although there is a limit of 500 different event types (names).
We’ll cover how this data is shown in the interface in the Reporting Sections part of this post below. Remember to check out the documentation for automatically collected events if you want to see the definitions for those events.
Events can be useful outside of Analytics reporting as well. Events marked as conversions can also be used to trigger Cloud Functions – this documentation shows a Cloud Function that sends the user a coupon after they complete a purchase, for example. Take a look at the documentation to learn more.
User Properties
Labels you can assign to individual users, which persist throughout future activities in the app starting from the date they are initially assigned. Think of these as user-level custom dimensions. You can set up to 25 custom User Properties. If we compare that to the number of custom dimension slots in Google Analytics, it is slightly higher than that of standard Google Analytics properties; but it may be a disappointment to those using Google Analytics 360 properties that have a limit of 200 custom dimensions. Just remember that you can also utilize up to 25 additional parameters on events logged with Firebase as noted above.
These are primarily used to build Filters and Audiences. Filters, as described below, allow you to segment the data in your Google Analytics for Firebase reports. Audiences can be used to build Filters for analysis in Firebase, but they can also be shared with AdWords and other Google advertising platforms if you link your accounts.
User properties can also be used with Firebase Remote Config for A/B testing as well – so you can test feature updates in your app with specific audiences that you have labeled with certain user properties. Take a look at this guide on Remote Config for A/B testing to learn more.
Revenue
There are a variety of revenue-related metrics that you will come across. If you haven’t monetized your app or if you do not have ecommerce in your app, these numbers will just be zeros. A couple examples include:
- “ARPU” = average revenue per user
- “ARPPU” = average revenue per paid user
Revenue is the sum of the ‘ecommerce_purchase’ and ‘in_app_purchase’ event values.
Date Range
The default date range is the past 30 days (which does not include today). You can change the date range with the date range selector in the top-right corner of the interface:
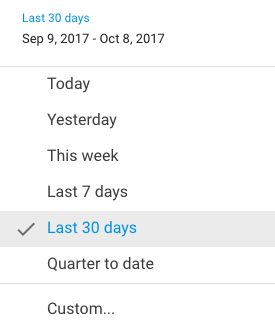
The comparison date is the previous period.
Data is often fresh within a few hours, though it can take longer depending upon a number of factors. In my experience, it takes much longer for brand new Firebase projects to start showing data in the reports.
Filters
Filters are a lot like Segments in Google Analytics; they allow you to look at specific buckets of traffic and navigate around the various reports without having to re-apply the filter.
To add a filter to any report, click on the Add Filter button in the top-left and choose the conditions of interest. For example, you can build a filter based on custom User Properties that you are defining in your app (described below) or properties that Firebase collects for you (demographic information associated with the user’s device identifier). Or build a filter based on an Audience you have already defined (Audiences covered below). There are some built-in Audiences as well, such as “Purchasers” and “Crashing Users.”
Reporting Sections in Google Analytics for Firebase
Highlighted below are the key components of each of the main reporting sections.
Dashboard
The Dashboard shows some quick snapshots of key metrics such as active users, revenue (if you’re using ecommerce), first-open attribution and retention cohorts, app engagement, device and demographic data and more. Some of the widgets in the Dashboard provide links to dive deeper in a more in-depth report for that section.
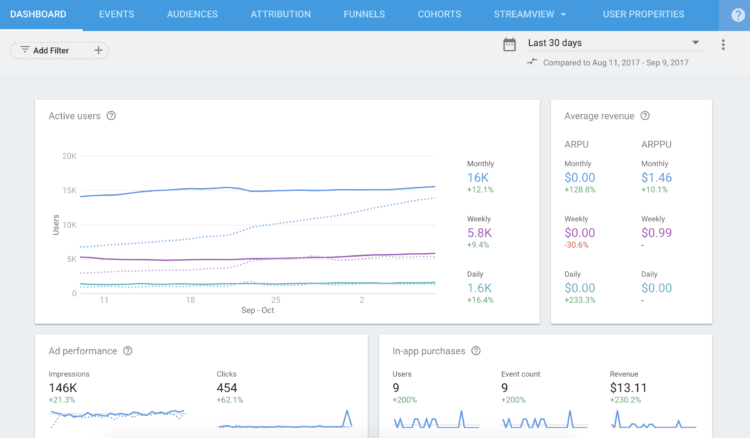
There isn’t a breakdown of “new users vs returning users” – the focus is on user engagement and then you can see the total number of ‘first opens’ in the Attribution section, which is the amount of times the app was opened on a device for the first time.
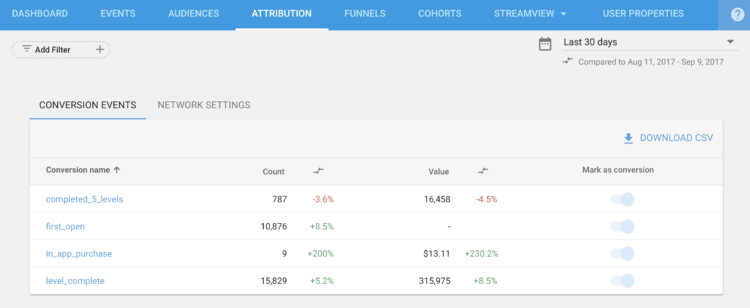
Events
The Events tab provides an overview of both the automatically collected events and any custom events you have configured in your app. Take a look at the documentation for a full list of the automatically generated events.
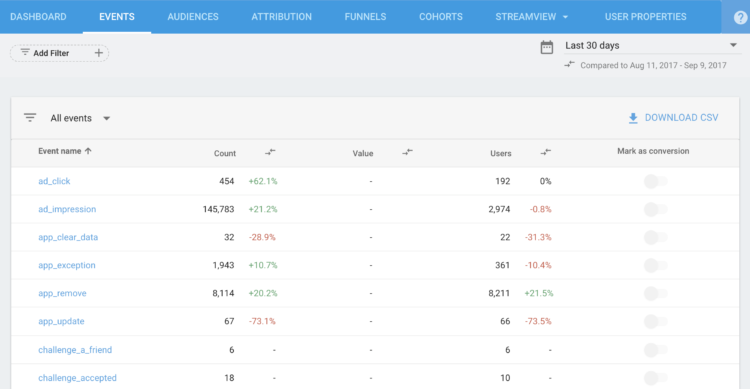
The report shows a list of the top events in your app by total events (Count) and total Users who triggered the event. If you send an event with a numeric value instead of a string (and you include a currency symbol), you will see the total in the Value column.
Mark an event as a conversion by clicking the toggle under the “Mark as conversion” column in order to see it in your Attribution reports.
Clicking on an event in the list will provide a more detailed breakdown of stats for that event. However – one important detail about the Events report in Firebase is that it does not automatically provide drill-down reports for parameters associated with an event. If you want to see the additional parameters that you are including on certain events in your app, you must enable them in the interface. Unlike the Top Events report in Google Analytics mobile and web views, you will not see the breakdown of all parameters associated with an event automatically.
To enable reporting for these parameters, you must “register” them in Firebase. Once you have done that, you will be able to drill into a particular event to see individual cards for each custom parameter associated with it that you have registered for reporting. You can also export Firebase data to BigQuery as well, where you can see all of the parameters for each event.
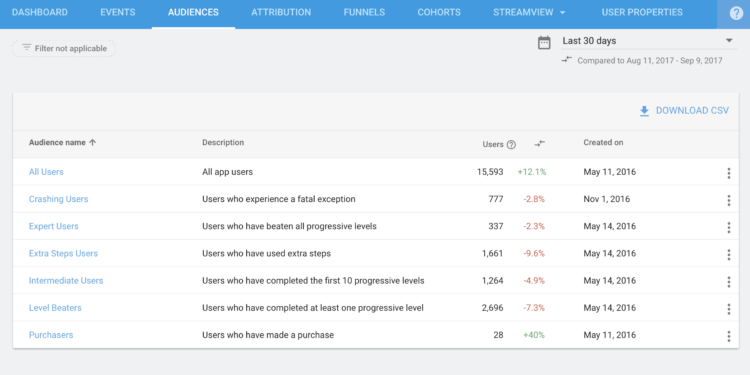
Audiences
Audiences are groups of users – there are certain groups that are automatically generated for you, such as “Crashing Users” and “Purchasers” and there are custom Audiences that you can configure.
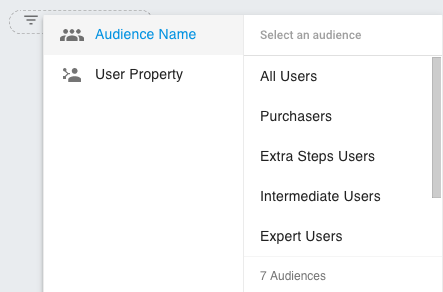
This screenshot is from the Firebase Demo (link at the top of this post), but you will see a blue “NEW AUDIENCE” button in your own Audiences report next to the “DOWNLOAD CSV” link if you have the right permissions. To create a new Audience, click that button and choose the conditions of interest. In this example, we have an Audience of all users from the United States:
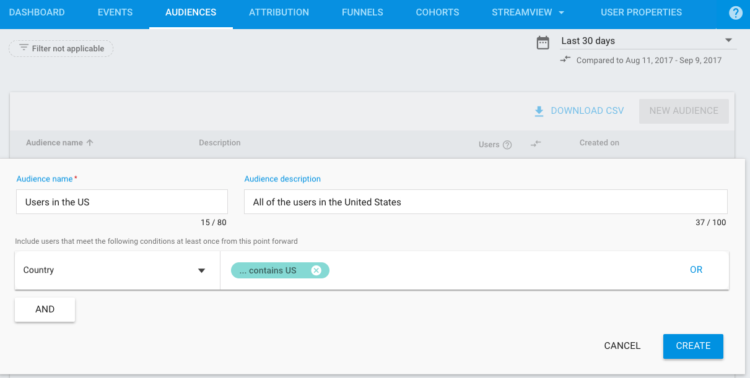
A couple quick (but important) notes about Audiences:
- You can create up to 50 Audiences.
- Audiences are NOT retroactive – they only accumulate users after they are created.
- Audiences are user-scoped. There are no session-based Audiences (like you can create in traditional Google Analytics).
- Audiences can also be used for targeted Notifications and custom experiences using Remote Config.
Attribution
The Attribution report aims to help you understand how various marketing channels are driving conversions.
Certain automatically generated events are already marked by default as conversion events – ‘first_open’ and ‘in_app_purchase’ events, for example. Events that you have marked as conversion events will also appear in the Attribution report – you can set up to 15 custom conversion events per project.
Click on a particular conversion to see more detailed information including total events over time and events by source. Here is an example from the Demo account of a breakdown for the ‘first_open’ event (the first time an app is launched on a device):
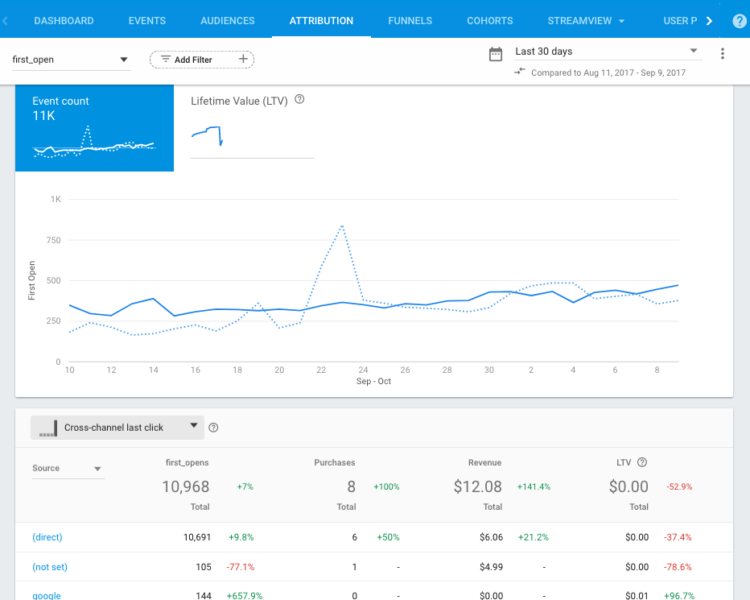
Click on a source of interest to see the associated Medium(s), and choose a Medium to see the associated Campaign information.
Google Analytics for Firebase uses a last-click attribution model by default; the only other option is AdWords preferred.
Attribution for mobile apps is a very complex and messy topic that I can’t squeeze into this post. Take a look at the documentation for the Attribution report if you would like to learn more for now. At a high level, there are “supported ad networks” that cooperate with Firebase and pass campaign information and there is an option to link your AdWords account to Firebase to see AdWords appear in your Attribution reports. Configure the networks you are using on the “NETWORK SETTINGS” tab. You may also configure Postback Conversions in order to send conversion data from Firebase to other advertising platforms.
Additionally, there is another tool you can use called Firebase Dynamic Links which allows you to drive traffic to specific content within your app if the user already has the app installed – if a Dynamic Link is visited by a user who does not yet have the app installed, they are directed to the appropriate app store page for the app. It is possible to attach campaign parameters to these links – check out the documentation on Dynamic Links for more information.
You might be thinking, “How do I see app engagement for my campaigns when there wasn’t a conversion? How about conversion rates per channel?” Unfortunately, all attribution data in the Firebase Attribution report is from the perspective of conversion events – a conversion must happen in order for attribution information to appear here. If you are using the Dynamic Links feature and tagging your links appropriately, you can review app opens from those campaigns (including ‘first opens’) in the separate Dynamic Links section of Firebase (outside of the Analytics reports). Not to get too into the weeds, but the Dynamic Links SDK emits events in your app as well – such as ‘dynamic_link_first_open’ and ‘dynamic_link_app_open’ – those events will appear in your Events report in Google Analytics for Firebase. Mark them as conversion events in order to monitor their performance in the Attribution report as well. Learn more about this feature here.
Funnels
Funnels allow you to compare how users interact with specific activities in your app. Firebase uses open funnels, which means that they are not filtered to a specific sequence. They are basically just a visual representation of how often event A occurred compared to event B in your Firebase funnel; the user does not have to trigger event A before event B. In order to realistically think of these as events in a sequence, Firebase suggests that you use funnels for “sequences of events that occur naturally within the app.”
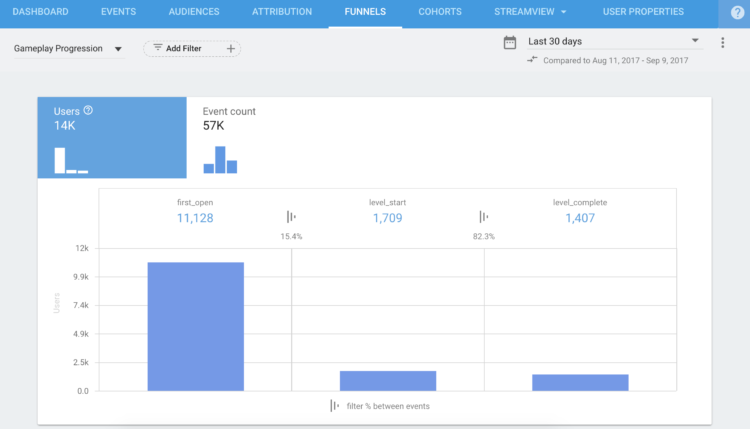
You can apply a Filter to this visualization, but at this time there is no way to build an Audience for users who progress through certain steps (like in the Enhanced Ecommerce > Shopping Behavior and Checkout Behavior reports in Google Analytics).
Cohorts
The Cohorts report in Firebase is very similar to the one in Google Analytics for web and mobile views; it shows user retention rates based on acquisition date:
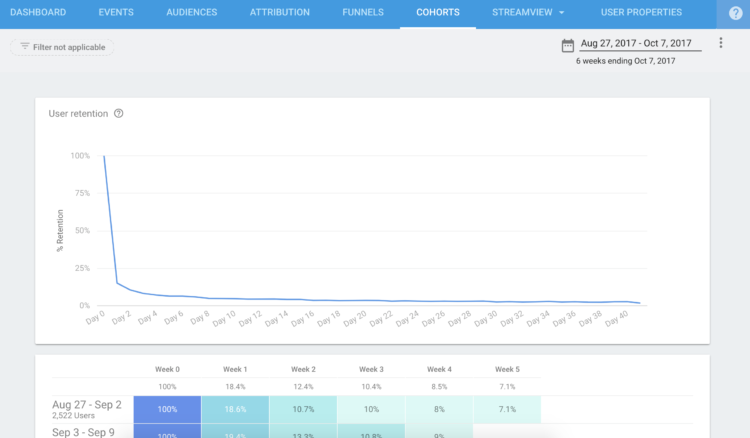
You cannot apply filters to this report at this time.
StreamView
StreamView is basically Firebase’s Real Time reporting section – it shows current activity around the globe looking back to the past 30 minutes:
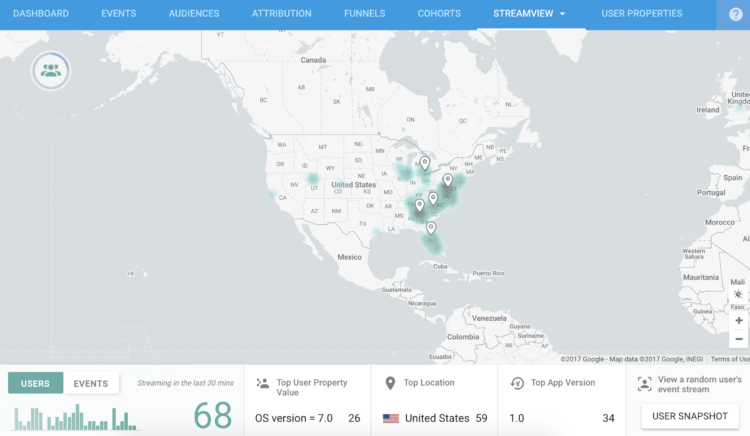
You can see these reports from the perspective of users or events – there is a toggle at the bottom left-hand side of the screen that allows you to plot active users or events being triggered. Underneath that toggle is a bar graph showing a trend for users or events (whichever perspective you have selected) over the past 30 minutes. To enlarge this graph, hover over the Users / Events toggle buttons and select “TIMELINE DETAILS:”
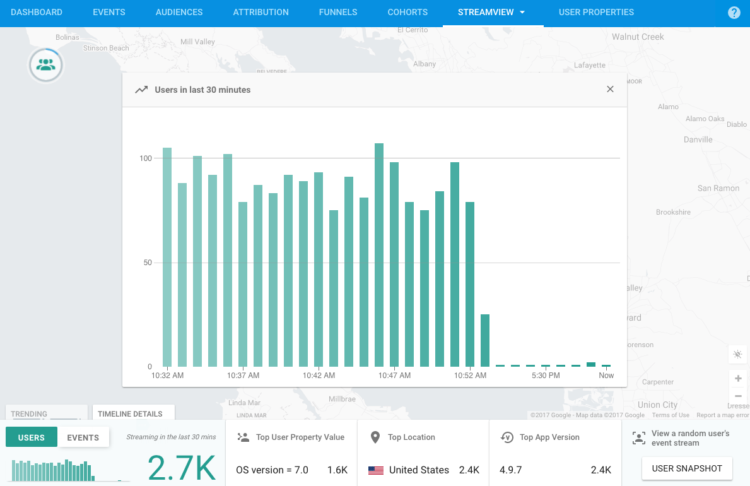
This can come in handy when you want a quick overview on current trends, such as after an update is launched for the app or when a marketing campaign starts.
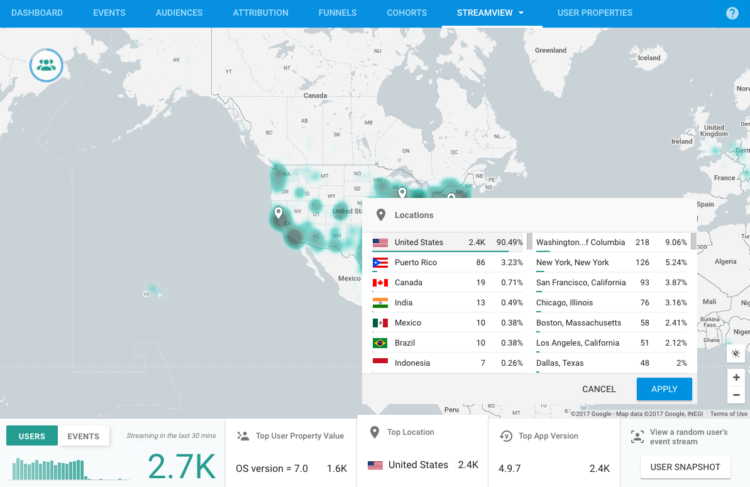
Across the bottom of the report you will see some high-level metrics such as total users/events in the last 30 minutes as well as the top user properties, locations and app versions. These are not just scorecard metrics though – you can actually use these options to filter the data in the report as well. For example, you can choose a specific location such as the United States:
You can also view anonymous user snapshots that provide a breakdown of all of the activity from a given user during the past 30 minutes by clicking the “USER SNAPSHOT” button in the bottom right:
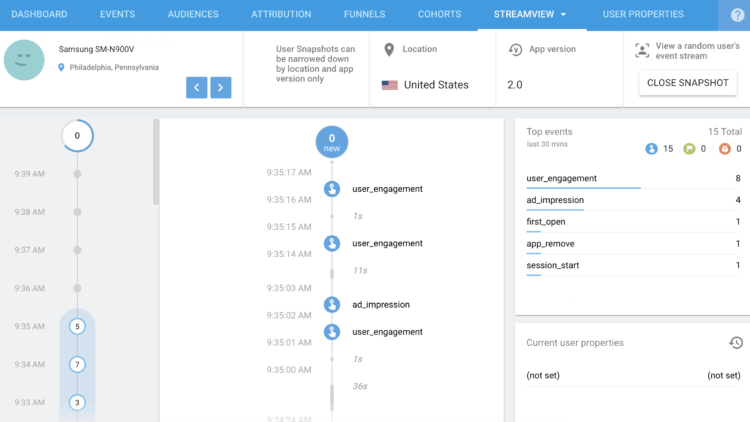
You can select an event from the timeline in the User Snapshot in order to see additional parameters that may have been associated with that event or properties associated with that user. Add a filter before entering the User Snapshot report in order to segment the users that appear (you cannot segment them once you have opened the User Snapshot report). Choose “Close Snapshot” from the top-right in order to exit the User Snapshot.
DebugView
There is also a DebugView report under the StreamView drop down. There are some steps to enabling debug mode, but once you have it configured this report will show hits sent during debugging so you can verify your implementation. The report looks very similar to the StreamView report as the data comes in.
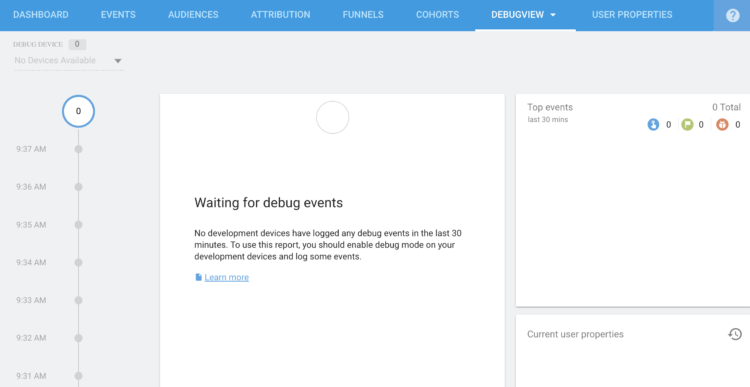
We will have to write a separate blog post on the debugging process – but I encourage you to share this feature with your development team.
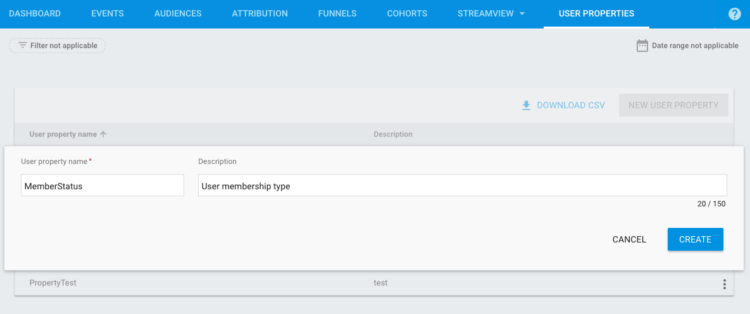
User Properties
And finally, User Properties. This section is not really a report but rather a means to configuring new User Properties that you can use in Audiences and Filters. Think of User Properties like user-scoped custom dimensions in Google Analytics – once a property is set for a user, it persists with every future interaction for that user.
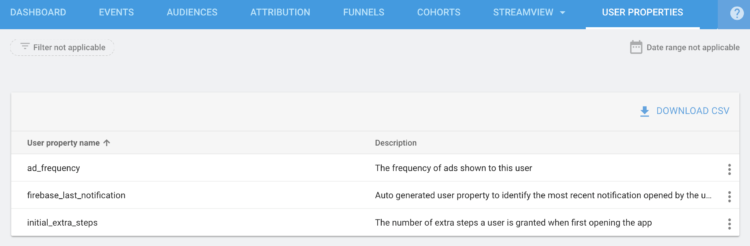
As mentioned earlier, User Properties are great for building Filters to use to segment the data in Firebase and for building Audiences.
User Properties are actually defined with code inside your app, in a manner similar to logging events. Take a look at the Android and iOS documentation for more information on how to actually set that up.
Then in Firebase, you need to configure the User Property based on the data you’re collecting in the app – so you’ll want to know the User Property name in order to utilize your User Properties in Audiences and Filters in Firebase.
Summary
Hopefully I covered all of the reports in Google Analytics for Firebase, at least at a high level. There is so much more to talk about though that couldn’t quite fit in to this article. I’m sure we’ll provide additional, more in-depth posts in the future. Let us know in the comments if there are specific features you would like us to write about next!
News & Insights
Related Perspectives


