AdWords Competition: Battling Over Prime Real Estate

Top of page competition is fierce. I recently worked with a client who was experiencing a drop in impression and click volume month-over-month. After some investigation, it was determined that the cause was an increase in competition for prime real estate on the SERP.
The battle for prime SERP real estate, in a way, reminds me of real estate developers competing for property with the best views in my beloved hometown of Pittsburgh.
Pittsburgh is a strikingly picturesque city with skyscrapers of a bustling downtown area contained between 3 rivers and nestled in a valley surrounded by foliage covered hillsides and bluffs.
Atop one of these bluffs to the south of the city sits Grandview Avenue, offering, as you may have guessed, a grand view of the stunning city-scape below.
Houses and condos on Grandview Avenue can sell for up $1 million. Similar properties mere blocks away often sell for less than a quarter of that.
Homebuyers and property developers compete for coveted prime real estate offering panoramic city views similarly to how marketers and advertisers compete for the coveted top of page ad slot real estate on the SERP which offers maximum ad exposure.

I’m going to walk through the simple steps that I took to investigate the decrease in volume, assess the competitive landscape and gain back lost volume.
The Investigation Begins
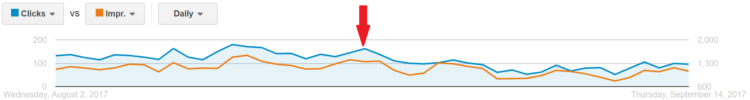
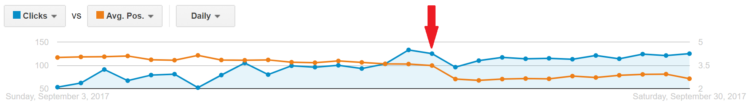
The first step was to find out when the drop in Clicks and Impressions started to occur to give a frame of reference for comparison. As a starting point, I found it easiest to plot Clicks and Impressions over time on the handy graph in the AdWords interface and give it the eyeball test.
Just by looking at the graph, it appeared that the decline began around 8/23:
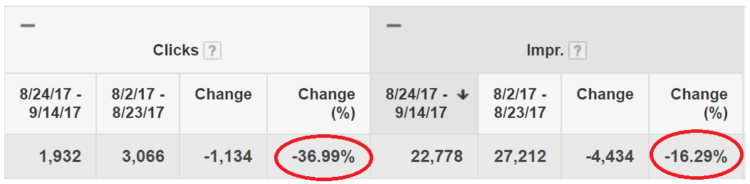
After my visual “guesstimate” I wanted a more quantitative look. I split the time period in half, and compared them to each other using AdWords’ compare date range feature. There was, in fact, a pretty significant decrease in Clicks and Impressions volume:
After figuring out the when, I next had to figure out the why?
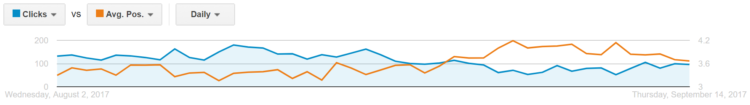
Again, using the graph in the AdWords interface, I wanted to investigate what impact Avg. position was having on volume over time. It turns out that Avg. position was increasing (getting worse) over time, and was directly correlated with the decline in volume I was seeing:
To make matters worse, the increase in position also lead to a decrease in Click-Through Rate (CTR):
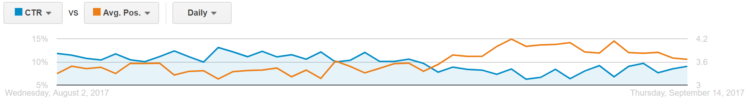
The decrease in CTR that was associated with the increase in Avg. Position further exacerbated the decrease in Click volume. That is why Click volume had decreased by a greater percentage than Impression volume in the table above.
I had determined that an increase in Avg. Position over time was a big factor contributing to the decrease in volume. But why was Avg. Position increasing?
Avg. CPC increased slightly over that time period, but more-or-less remained relatively steady:
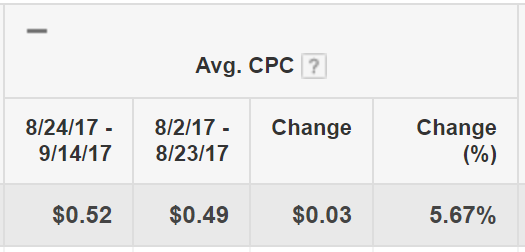
The client was not becoming less aggressive in their bidding, so why the decline? Perhaps competition was becoming more aggressive.
Assessing The Competitive Landscape
When assessing competition one of the first metrics that I often look at is Impression Share. Comparing Impression Share across two time periods is a great litmus test of how you’re stacking up against the rest of the competitive landscape.
Search Impression Share had seen a decrease, Search Lost IS (rank) increased:
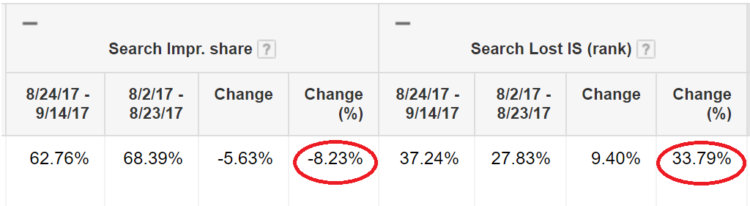
The decrease in Impression Share coupled with the increase in Search Lost IS (rank) indicated to me that competition for prime real estate was increasing and competitors were outranking us at a higher rate than they previously had.
To confirm my suspicions, I compared Auction Insights Reports (found in the “details” drop down) for the two time periods. I’ve translated this into an excel table for ease of viewing:
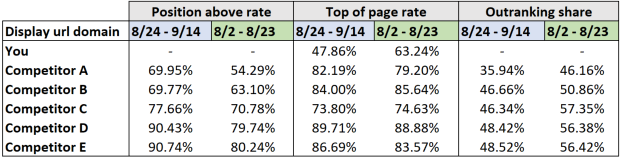
Interesting things to note here:
- Position Above Rate represents how often a competitor’s ad shows in a higher position than yours. All 5 competitors saw an increase here.
- Perhaps most telling—we saw a significant decrease in Top of Page Rate, while 3 of 5 competitors saw slight increases. This is akin to the prime Grandview Avenue real estate.
- Outranking Share represents how often your ad ranked in a higher position than your competition. We saw a decrease in the percentage that we were outranking our competitors, indicating that competitors had gained ground.
Gaining Back Lost Ground
As the evidence piled up, it became clear that competition was increasing and my client was failing to react appropriately to defend their prime real estate on the SERP.
Identifying the competitive challenges was the first step, but addressing those required some changes to our existing strategy. Among other tweaks and updates, the one that had the biggest change was to re-evaluate our bidding strategy. Specifically, we agreed to use AdWords’ automated bid strategy, “Target Search Page Location.” Michael wrote a great post about different bid strategies, which covers this specific one as well.
AdWords offers a handful of automated bidding strategies that allow an algorithm to automatically adjust keyword bids to achieve a specific goal. Target search page location essentially lets Google adjust keyword bids to keep up with the ebbs and flow of competition, without having to manually manage a large portfolio of keywords on a daily basis.
After implementing the target search page location automated bid strategy, performance briefly dropped as Google’s algorithm collected data and learned. Clicks then began to gain back lost volume as Avg. Position improved:
Of course, it’s also important to note that changing the bid strategy also resulted in changes to the amount that we’d end up spending. In this scenario, we had to increase our daily budgets slightly to account for more aggressive bidding.
News & Insights
Related Perspectives