Comparing Multiple Google Analytics Sources Recipe for Data Studio
Description
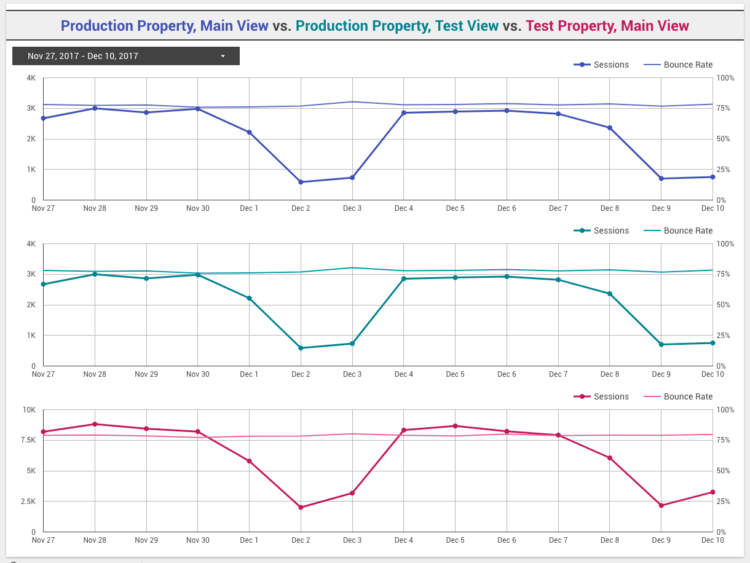
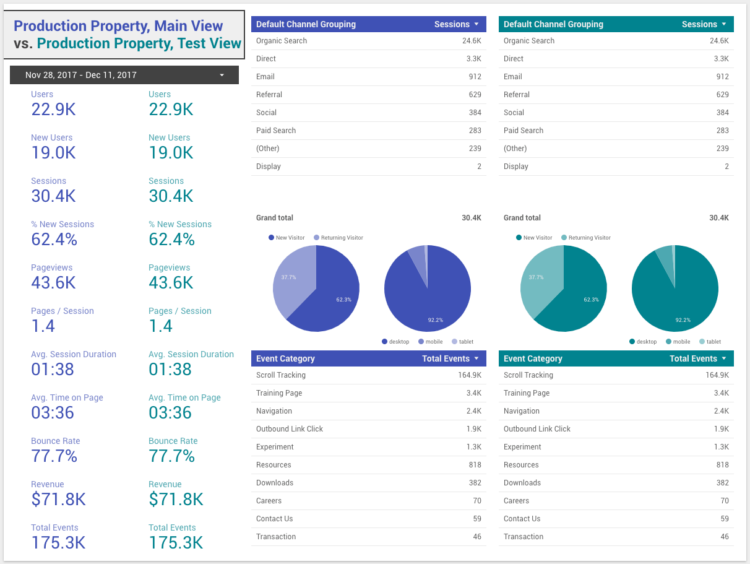
The template consists of four pages: one that compares session and bounce rate metrics for all three linked views and three that compare each combination of GA data sources.
There’s room for three possible data sources as placeholders:
- Production property, Main view
- Production property, Test view
- Test property, Main view
You may not need all of those data source combinations – for example, if your Production property test view configuration is identical to your production property main view configuration, you may not need that page of the report – but the combinations are there if you need them.
Instructions
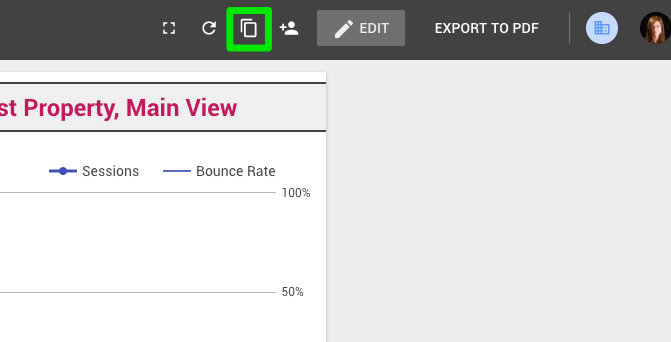
1. Make a Copy
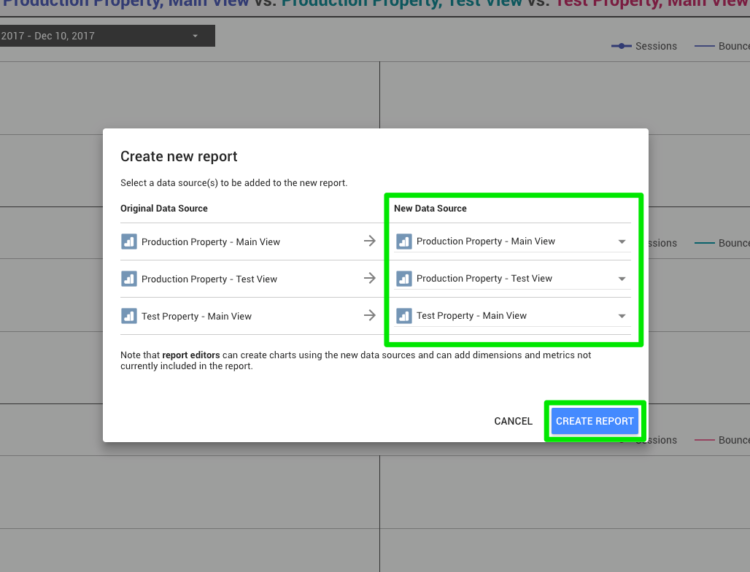
2. Link the New Data Sources to Your Own GA Views
And that’s it! The report should populate with data from your linked sources:
Adding More Comparison Sheets
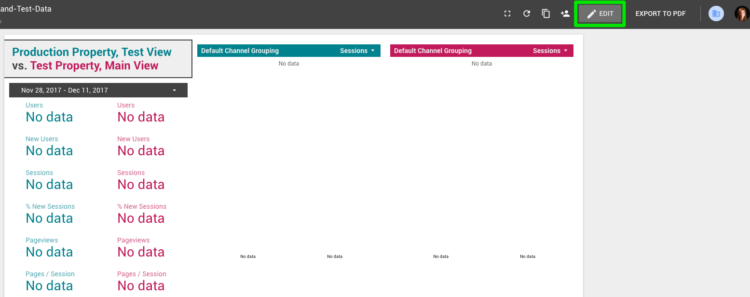
1. Enter Edit mode:
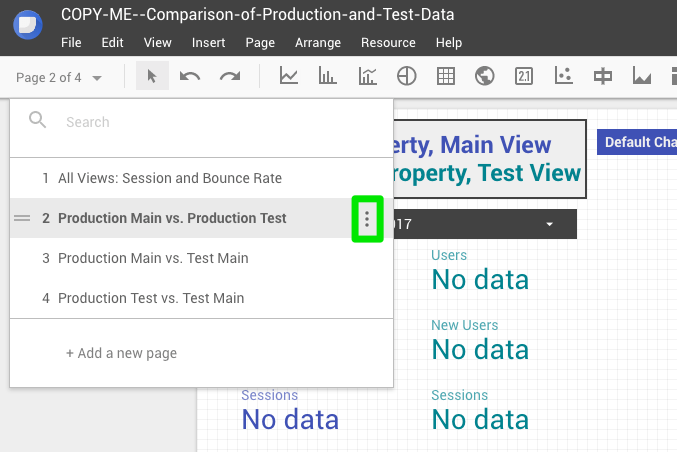
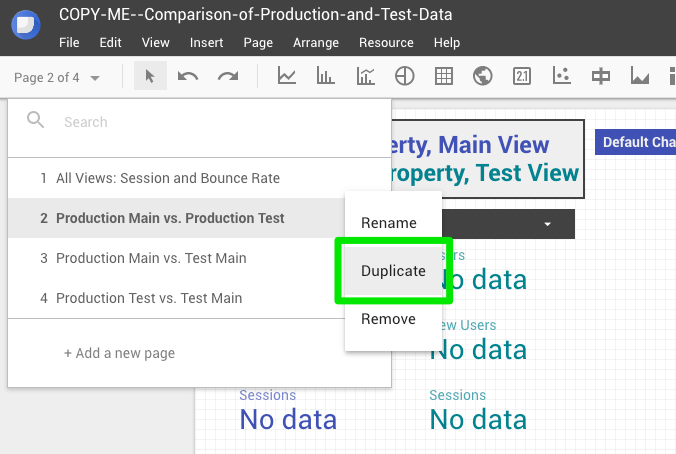
2. Make a copy of one of the comparison pages:
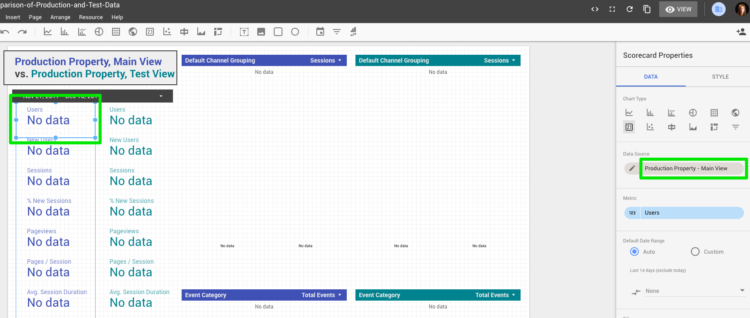
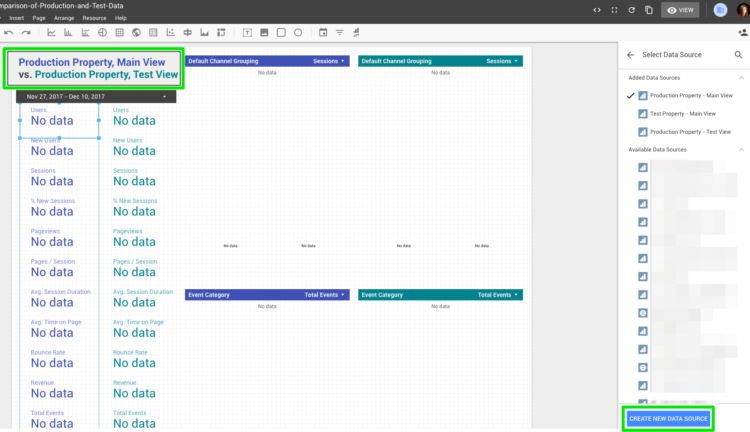
You can then click on each scorecard, table, or chart and change the data source to the view you want to pull data from:
Select the new data source from your list of added sources or create a new one:
And don’t forget to change the title of the page and the color scheme of your new pages to ensure that the data contained in them is understandable to anyone who may look at your report.
