Data Quality and Anomaly Detection Thoughts For Web Analytics
Data quality is an issue that affects nearly every organization. Web analytics data quality in particular is prone to many inconsistencies and errors. This can have a detrimental effect on the analysis that is possible.
Missing or inconsistent data prevents the types of analysis that can lead to significant cost savings, or help inform website decisions, which can lead to increased revenue. Sometimes, issues with data quality can be easily spotted. Data has dropped off completely for a day, there are only zeros. Piece of cake.
Unfortunately though, data quality issues are often “hidden” in sub-segments of the data, making them difficult to discover.
Consider the following example:
Acme Cookies sells a lot of cookies on their website. They track a lot of different user actions on the site that helps them analyze important behaviors, like adding an item to the cart.
One day, a Senior Analyst (let’s call her Jane) is looking into the effect of product videos on purchase behavior. After spending a couple hours segmenting and exploring the data from various perspectives, she notices some peculiarities – something doesn’t quite add up. She digs a little bit further, and finds that video tracking stopped working on the mobile platform three months ago!
Now, she’s spent an entire day and ultimately can’t answer the import question of how much impact product videos have on purchases. Her boss is going to be mad, because there’s a big push internally to produce more product videos, and now they don’t have the data to support that decision.
Does that sound familiar? Have you been in that situation where you found that your tracking stopped working, just when you need it most?
Data Quality
In large organizations there are often many teams involved in the web design and development, marketing, user experience, analytics and testing. This often leads to inconsistencies in the data, and sometimes to disruptions in the data collection. For example, if a new page template is created but the developers forget to include the tracking code, this can lead to missing data, making the analysis difficult or impossible.
To complicate the matter, it’s common for minor disruptions in the data that only affect a smaller segment of website visitors that isn’t easily seen in aggregate. For example, there could be a JavaScript error which only affects users who are on mobile devices with a specific browser.
We recommend testing plans and these are certainly important in catching problems with new pages or sites before they go live, and even on a recurring basis.
Creating a Test Plan for Google Analytics Implementations
Published: August 22, 2017
Currently, an analyst may have to manually check the data on a regular basis to ensure consistency. However, that’s a suboptimal use of an analyst’s time, and is still prone to missing issues that only affect smaller segments of the data. This often leads to the issues being uncovered when it’s too late, as the analyst is actually trying to analyze the data and they realize it’s missing or inaccurate.
Data Quality: Existing Tools vs. Build Your Own
There are tools on the market that aim to help with data quality. For example, ObservePoint and Hub’Scan are two tools that monitor your site for data collection on a regular basis. They rely on analysts writing tests to tell the tools what they expect to see. The tools then crawl the site to examine what data is actually being collected to check if it matches expectations, alerting the analysts to any inconsistencies. This is similar to unit testing and regression testing in the software world.
When embraced by an organization that takes the time to implement correctly across their sites, these tools can be highly-effective at identifying issues with the collection portion of your site, that can hopefully be remedied quickly. However, these tools also rely on building dozens or hundreds of tests, which requires a level of sophistication and forethought to be effective. In a sense, you need to anticipate exactly what can break, which depending on how large your site is, might not be the most efficient use of an analyst’s time.
Other tools on the market take more of a machine learning approach, and focus instead on the reported data. In contrast to the above testing methodology, this is a more reactive than proactive approach. The idea is to monitor the data coming in and look for “anomalies,” or “things that don’t look right.”
Anodot, which has raised 12.5 million in venture capital, deals with all types of time series data and uses machine learning to detect anomalies. Alarmduck is another similar tool that is newer to the market, and currently works with Adobe Analytics, Google Analytics, and Google AdWords data.
In addition to paid tools and services, it’s possible to go the open source route and use R or Python (or whatever your statistical software of choice), and build your own tool. If you have some programming and statistics knowledge (or have someone on your team who does), you can be up and running with an anomaly detection model fairly quickly.
Although there are many approaches to anomaly detection, we’ll explore one method below (temporal scan). But before we get to that, we need to define what we’re looking for.
Definition of Anomaly
There are many different types of anomalies that exist in data. For the purposes of this post, we are narrowly defining an anomaly as a difference in pattern between a subgroup of the data and the rest of the data. For example, if the number of purchases from people on desktop computers and tablets is relatively steady, but purchases from people on mobile devices drops sharply, that would be an anomaly.
Along with defining what we consider as an anomaly, it is important to state what we do not consider to be an anomaly. If there is a spike up or down, a step change, or a trend up or down that occurs in all segments of the data, we do not consider this an anomaly. The reason for this choice is that those changes in data are much easier to detect without any specialized tools.
This definition is important, as it allows us to focus on differences in segments of the data that would not be as obvious when looking at the data in aggregate. As long as the changes don’t occur uniformly across all segments of the data, we will be able to detect positive and negative spikes, step changes, and increasing and decreasing trends.
Given this definition of anomaly, one good place to start is with the temporal scan method.
Temporal Scan
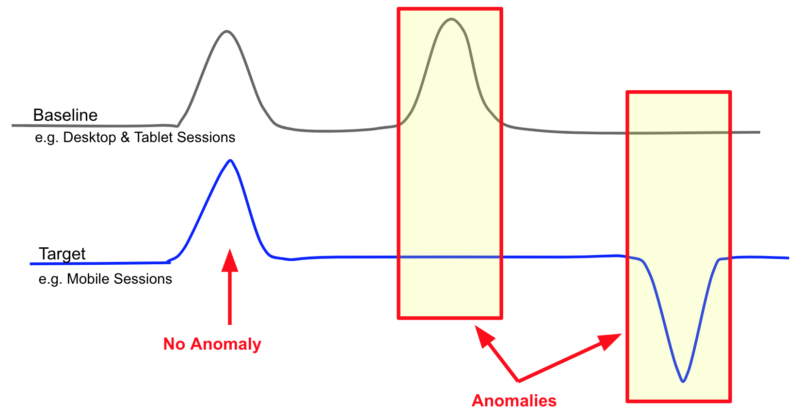
Since the anomaly we want to detect is the difference in pattern between a subgroup of the data and the rest of the data, the temporal scan method is a good fit. It compares the performance of a baseline with the target. For example, the target could be sessions from mobile devices, and the baseline would be sessions from all non-mobile devices (i.e. desktop and tablet).
There is an assumption that in a given timeframe, the relationship between baseline and target group will remain the same (or close). For example, if the number of sessions from desktop computers increases, we expect to also see an increase in sessions from mobile and tablet devices. Although this isn’t always the case (e.g. new marketing campaign that targets only mobile users), it is a helpful starting point.
In addition to breaking out a target and baseline, we also need to look at two timeframes for each – a current timeframe and a previous timeframe. In essence, this allows us to check that the actual value of the target is within a reasonable range of the baseline.
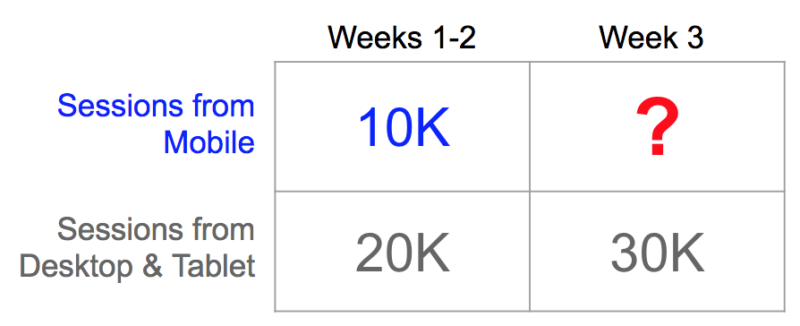
In the example above, we would expect that sessions from mobile in week 3 would be approximately 15,000. If we see that there are only 12,000, for example, how surprised should we be? In other words, how much of an anomaly would that be?
We can use Chi-square test or Fisher’s exact test to provide a statistical measure of how unlikely any given number would be. If we slide the previous and current timeframe pairs along a timeline, we can then compare the significance of difference between different time windows and pick the most significant (e.g. the top 10).
Ultimately, we have options. We have proactive testing before we launch, continual site monitoring after we launch, and then various ways to scan collected data after it’s collected. Many of us are currently doing at least one of these options, but ideally – we’d all be moving towards a more comprehensive approach towards data quality.
In a future post, I will share with you the R code to pull your Google Analytics data into R and do this anomaly detection. Then we’ll explore options for visualizing the anomalies, including ShinyR dashboards.
