What Are The Most Important Google Analytics Metrics?

Most people report on users, sessions, and pageviews as key performance indicators, which is a great place to start, but what other high-level metrics should we observe?
Google Analytics gives us a lot of valuable metrics, and we can even create our own custom metrics and calculated metrics. These metrics will vary by site type and job title. Let’s take a look at which metrics are most important by type and what they can tell you about a website.
Site Type
Most companies can be classified as an ecommerce, lead generation, or content site. Each of these site types are very different, so metrics we use to report on these websites will vary.
Ecommerce
Ecommerce websites are typically the easiest to report. The goal is clear: increase how much and how often your users are spending. In addition to metrics like sessions and pageviews, we often look at ecommerce conversion rate and average order value as KPIs.
These metrics are important for benchmarking and goal setting:
Revenue Per Visit (Calculated Metric)
Revenue per visit (RPV) can easily be calculated by dividing revenue by sessions, or multiplying ecommerce conversion rate by average order value. RPV is an important metric because it tells us how on average how much money each session is worth, and is also a combination of our two most important ecommerce metrics. Use this metric to determine session value across different segments of users such as traffic sources or user type to find actionable insights. You can set up RPV as a calculated metrics using either calculation.
Cart-to-Detail Rate & Buy-to-Detail Rate
Cart-to-detail and buy-to-detail rate are two out of the box metrics in Google Analytics that are often overlooked. Cart-to-detail rate indicates how often a product is added to cart after being viewed, while buy-to-detail rate tell us how often a product is purchased after being viewed. These metrics are important because they are great indicators of product performance. If we see a product that is not at the top of our list in terms of quantity or product revenue but has a high cart-to-detail or buy-to-detail rate, maybe we need to take another look at product placement or navigation issues.
You could have a valuable product that not enough users are finding. You can also compare these rates to each other to get a sense of product performance between a user adding to cart and making a purchase. You’ll find these metrics in the Product Performance report.
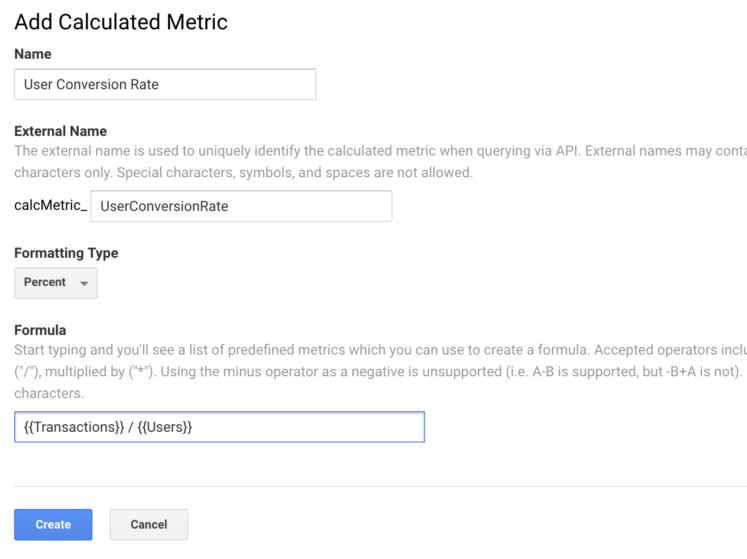
User Conversion Rate (Calculated Metric)
Ecommerce conversion rate calculates the number of purchases divided by the number of sessions. Another way we can look at conversion rate is by user. A person who comes to our site several times before making a purchase drives down ecommerce conversion rate. Looking at conversion rate at the user level tells us how many people came to our site and bought something regardless of how many visits it took before they purchased. User conversion rate can be created as a calculated metric by dividing transactions by users.
Lead Generation
Lead generation can include anything from newsletter signups to business leads to university enrollment. If you have a lead generation site, you should already have created goals in Google Analytics. If you need help setting up goals, check out this post.
Goal Value
Sometimes we can attribute or estimate a value for our lead goals. Adding a numeric value should be just as important to your goals as revenue is to transactions. Goal value allows us to provide tangible value to our website performance, especially when conversions can happen offline. You can find goal value in your Goal Overview report, or as a conversion metric in your audience or acquisition reports. You should add a value to your goals even if you don’t have insights into how much revenue your leads are driving to get a better understanding of our next metric.
Page Value
Page value is an important metric because it shows us which pages are contributing to conversions and how often. Donovan wrote a blog post giving us A Guide to Page Value explaining what the metric is and how it can be used. You should be adding the page value metric whenever you report on your site’s pages to see which pages are most valuable to your lead generation site.
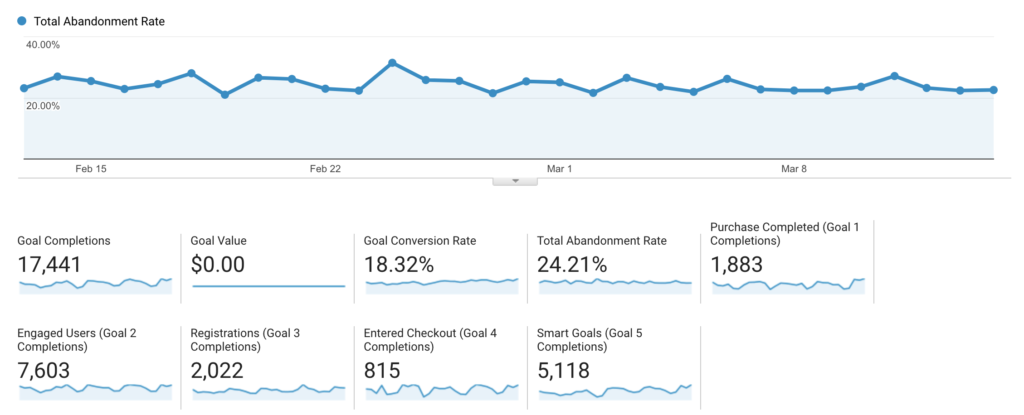
Goal Abandonment Rate
You’re probably already looking at goal completions for your lead generation site. If you have any destination goals set up, for example steps for an application, you should also be looking at the goal abandonment rate. Goal abandonment rate gives us the number of goal funnels abandoned compared to the number of goal funnels started.
If you have a high goal abandonment rate, maybe it’s time to take a closer look at your funnel. Which of you funnel steps are being exited on most often and where are your users going? You can also break out goal abandonment rate by different user segments. You’ll find goal abandonment rate in your Goal Overview report.
Content Sites
Content sites include publishers or educational sites. You’re already reporting on users, pageviews, or time on page, but what else can we add to enhance your reports?
Pages Per User (Calculated Metric)
Often times we look at the metric pages/session to measure engagement, but we can create a calculated metric to look see this engagement at the user level. Look at this metric by different audience segments to see where your most engaged users are coming from and what they’re viewing. This should give you ideas for action items to enhance the experience for all of your users and keep them engaged.
Social Hits
How often are your articles or content shared? If you’re a publisher, one of the most important things your users can do is share your content. Social sharing can help to determine what content types your users are interested in and what topics get them talking. You can look at social shares by article to see popular content, or by audience segment to see who is sharing most often. Set up your social hits as event tracking and use these events to create segments or goals.
Downloads
If your content site offers white papers, forms, or other downloadable materials, downloads is one of your most important metrics. Look at downloads by content or page to determine which content of site sections are most successful and find areas of improvement. Measure downloads by tagging file download links as events or creating calculated metrics.
Job Title
These site type metrics will provide more value to your business and help drive actionable insights. But what metrics are specific to your job role or department? Here are more metrics you can share with your team for better analysis by role.
Director of Analytics
Goal Conversion Rate
As the Director of Analytics, all metrics are important to you. You’re responsible for monitoring your site’s performance, taking action, and reporting to stakeholders. Ultimately, your mission is to get users to convert, so be sure to include your goal conversion rate in your analysis and reporting. If you aren’t doing this yet, you’ll need to break out your goal conversion rate across all dimensions to find your successes and areas of improvement.
Marketing Manager
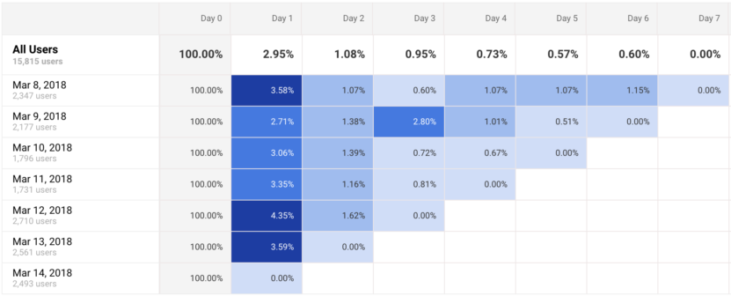
User Retention
User retention measures the percentage of users returning to your site days after their acquisition date. As a Marketing Manager, it’s important to understand how your campaigns drive traffic to your site. Look at user retention metric in the Cohort Analysis report to see how often users are returning to your site. Segment by specific traffic sources or campaigns to narrow in on your efforts.
Web Designer
Unique Pageviews
Unique pageviews tells us how many sessions in which a page was viewed. As a web designer, unique pageviews is important because it lets you know where a majority of your users are going and how to focus your efforts. Look at unique pageviews along with other page level metrics in the Content Drilldown report to find actionable items for sections of your site.
Ecommerce Purchaser
Quantity
Quantity is an important ecommerce metric and you should be using it if you’re not already. Quantity tells us how many units of a product were sold instead of looking at the number of transactions or unique purchases. Look at quantity in comparison to other product and product list metrics to find which products and positions are most successful and which are underperforming. You’ll find quantity in the Product Performance report.
Developer
Avg. Page Load Time
If you’re a developer you should be interested in the analytics around the site you built. In addition to seeing how many people are using your site, average page load time is an important metrics in analyzing your site’s performance. Use average page load time to determine site speed issues with your most popular pages or browsers. You can find average page load time in the Site Speed reports.

These metrics are meant to give you additional insights into your site’s performance and help drive business decisions. Be sure to add these metrics to your custom reports and Data Studio dashboards. Let these metrics inspire you to create additional metrics and expand your reporting and analysis.