Get the Most Out of Your Site's Internal Search Data

Google Analytics allows us to track internal site searches on our website, often without any changes to our website required! But what business reporting needs can we actually fulfill using the data collected? Let's take a look at the site search standard reports in Google Analytics, and just a few of the questions that we can answer using our site-search data.
If there is a search bar on our website, and most sites have one, then we should certainly be monitoring its usage. Some internal site search engines provide details on what people are searching for and how frequently. However, enabling and setting up site-search tracking with Google Analytics can also help us combine our site search analytics with information about how users arrived on our site or other behavior on our site, like pages visited or items purchased.
Setting it up is usually a breeze, though you'll need to check your own site and have a certain level of access to enable Google Analytics Site Search. See this blog post on how to enable site search.
Site Search Reports and What They Tell Us
Under Behavior > Site Search are four reports with information on our site search. Let’s investigate what each of these reports is telling us.
Overview
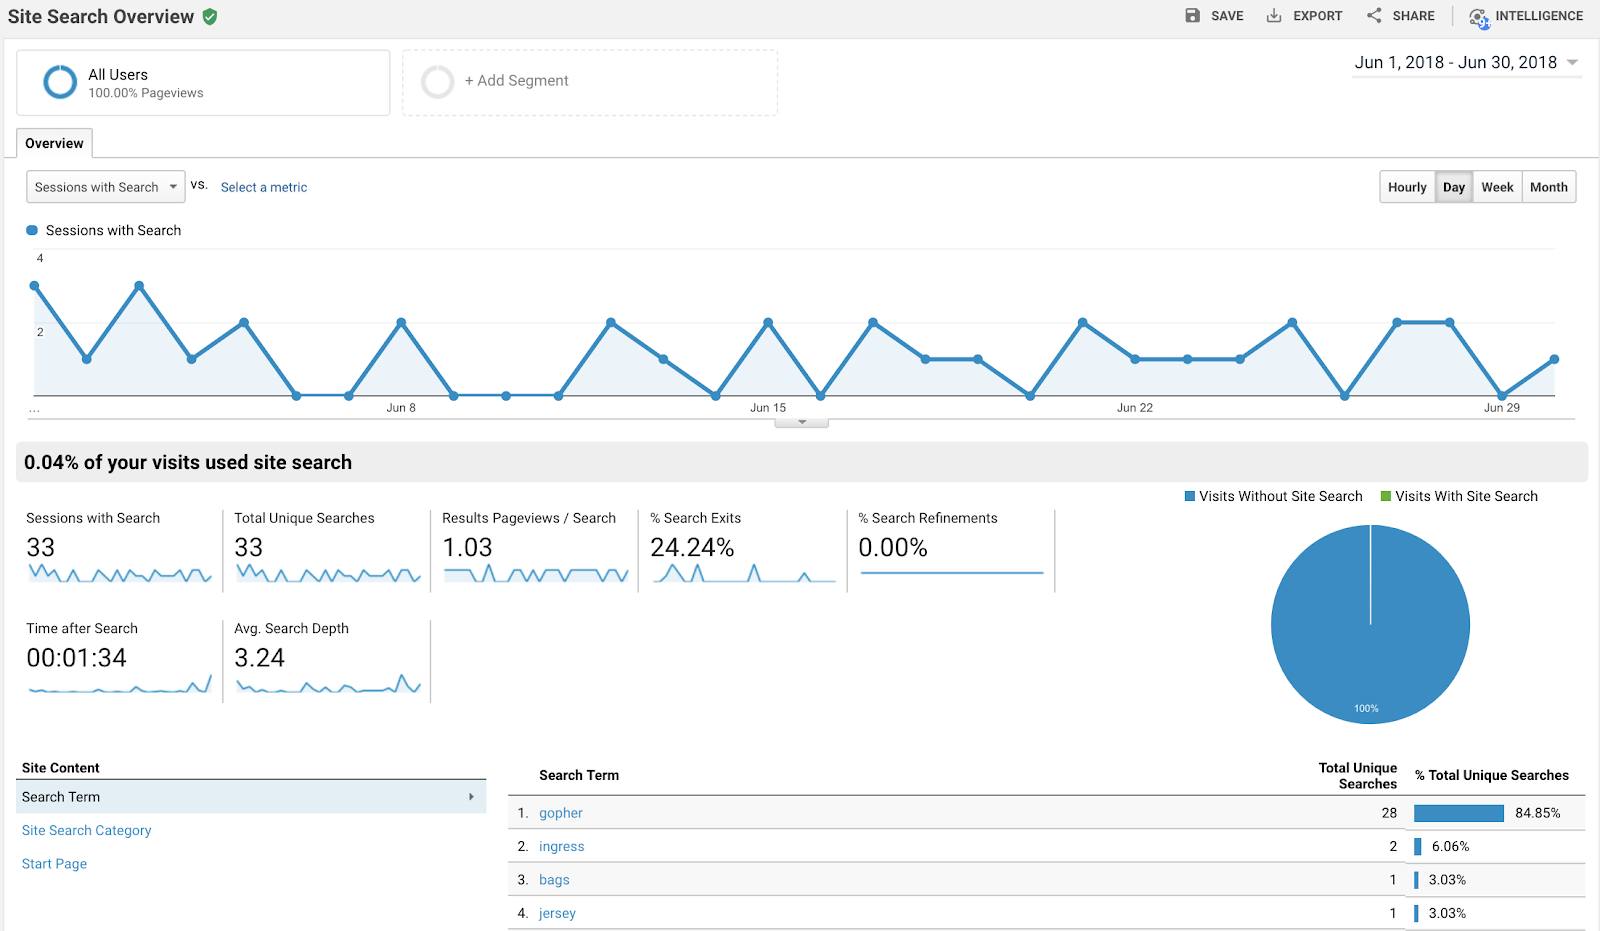
The first report in the drop-down menu is the Overview report. The Site Search Overview report looks like most other overview reports in Google Analytics; it has a timeline of Sessions with Site Search, scorecard, and pie-chart metrics about site search, along with a table showing the top search terms. This is a good place to check in on your site-search data.
Usage Report
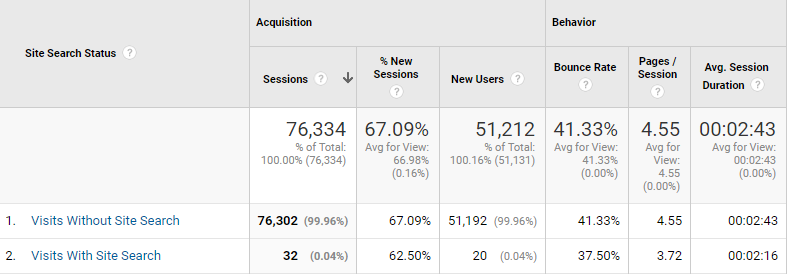
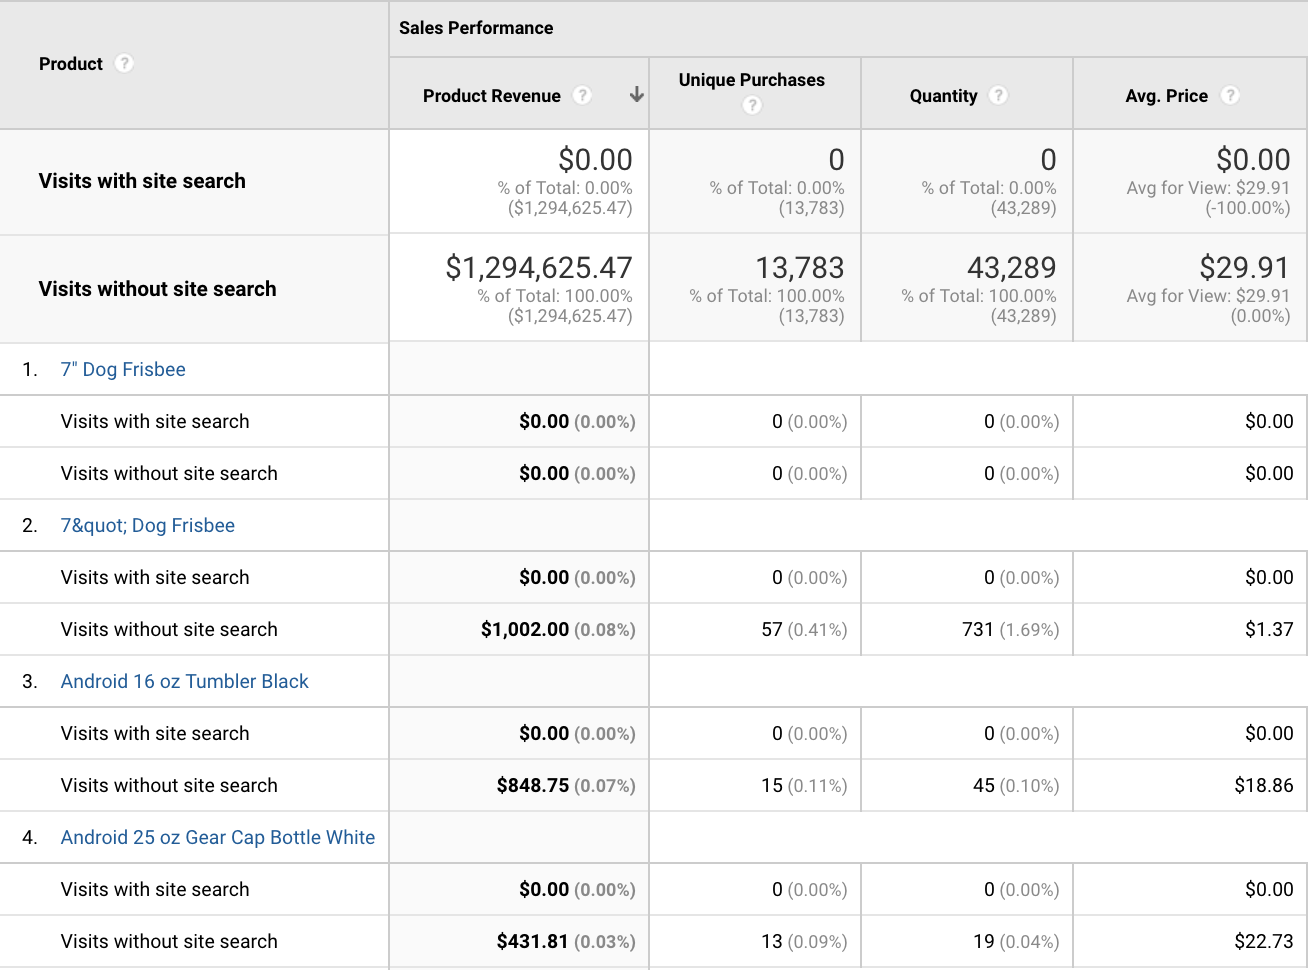
The second report is the Usage report. This report breaks apart metrics by Sessions with Site Search and Sessions without Site Search. eCommerce metrics are included in this table, allowing us to compare conversion rates between the two segments of sessions.
Search Pages
The Search Pages report shows us which pages of the website the user was on when they made a site search. "(entrance)" in this report means that visitors are entering the website on a search results page, probably due to search results from a search engine, or marketing efforts. This report can show us where users chose to use site search over navigating through the site. We can check that only pages we would expect to see a user searching on should be in this report. This table also allows us to change the primary dimension to "Destination Page," which shows us where a user went after searching.
Search Terms
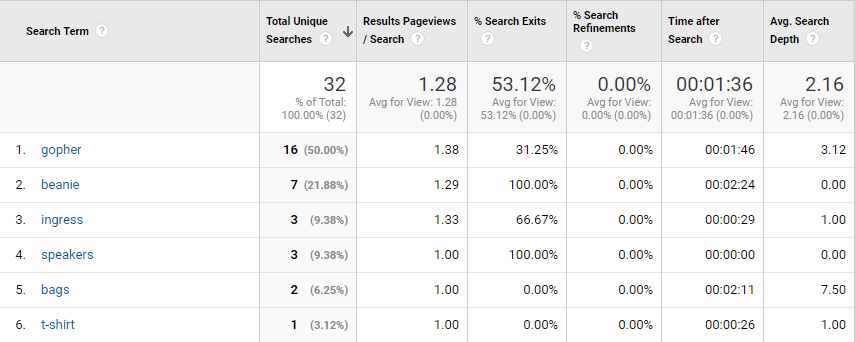
The next report is the Google Analytics Search Terms report and provides statistics on different search terms. It is full of data that we can use to answer other questions that may be of interest to us. This is the most exciting report usually, as we can see in their own words what our users are interested in. It can help with understanding what content is popular or perhaps more importantly, which content is missing or hard to find on your site.
(Hint: Remember that Google Analytics reports are case-sensitive. This is a great place to use a lowercase filter to clean up this report and consolidate search terms with different cases. Read more!)
Search Terms, Metrics, and Meanings
Total Unique Searches
This metric tells us how many unique searches by session were performed while adjusting for terms that are searched more than once per session. We can use this to identify what search items users are most interested in. In addition, it may be helpful to figure out trends, what items to promote, or keep in stock.
You can also use this to identify common misspellings of terms, or other phrases. If you're considering adding 'suggested search results' or optimizing your auto-correct, this is a goldmine of information.
Results Pageview /Search
This metric tells us how many pages of search results were looked at following a site search. If the number is higher than one or two, this could tell us that useful results are being surfaced well enough, or relevant results aren’t being shown.
Additionally, it can tell us the persistence of visitors, and how dedicated they are to finding a relevant result.
Percent Search Exits
This is the site search equivalent of Bounce Rate and tells us how many users left the site after viewing only a single page.
The higher this percentage is, the less satisfied the users were with the search results. Perhaps a visitor comes to our website for something specific and leaves if it’s not available, or perhaps the returned search results weren’t satisfactory, and site search should be tuned.
Percent Search Refinements
Search refinements are added terms to the original search term that help narrow (refine) the returned results. For example, a search term “shoes,” might be refined to “hiking shoes,” to help reduce the number of returned results.
Refinements are neither good nor bad; it all depends on the context. If the original term was broad (e.g. “shoes”), refinements can be expected. However, a high percentage of search refinements combined with a high percentage of search exits can signify a problem. The search engine needs to return quality results in order to keep users engaged.
Time After Search
Time after search refers to the amount of time users spend on the website after performing a search. The last metric is Average Search Depth and tells us the number of pages viewed after performing a search.
If these two numbers are high, it means that a visitor continued on to other pages of our site after performing site search and that our website's search function is probably fine. If these numbers are low, then it might be time to revamp site search.
Note that we can change the metrics in our table by clicking "eCommerce" (or a goal set) in the tab above the timeline in the explorer report.
Site Search with other Google Analytics reports
Segments
These standard reports listed above aren’t the only way we can gain insights from site search. Below are a few additional ways we can view reports.
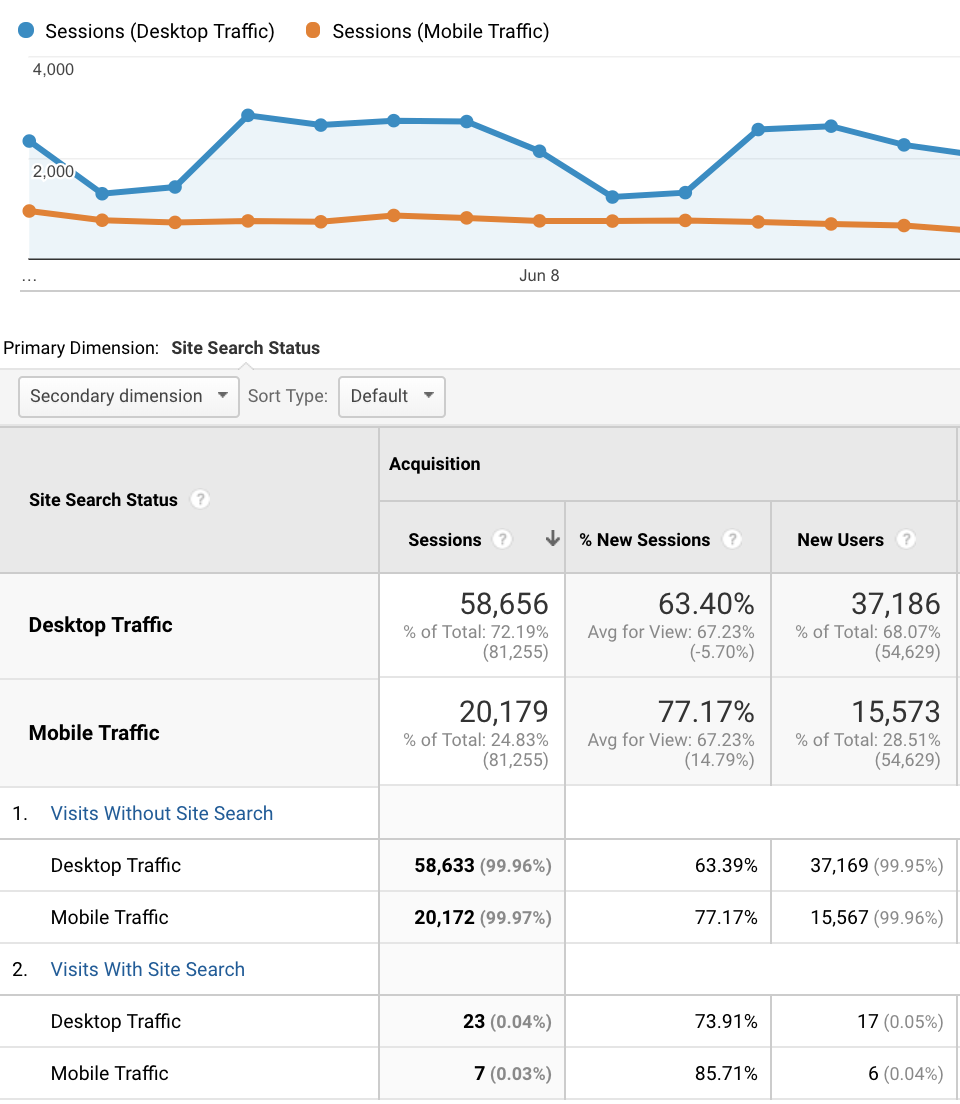
The first way, we can understand user behavior is by creating segments. We can create two segments, one including sessions in which a user performed site search, and one including sessions in which a user did not perform site search (or, a segment excluding sessions in which a user performed a site search). Keep in mind the scope of the segment; this is a session-level segment, so we’re seeing all hits from a session where a user at some point used site search.
There are other ways to set up this segment if site-search wasn't correctly set up, and now we need to sift through our data. We can find ways to extrapolate if a user performed a site search, and then create a segment based on those actions. For example, we can create a condition in which the page URL contains "/search/". Or maybe our search results page URL includes "/results", and we can filter on these terms. There are also some out-of-the-box ways to track site search (check out this post), and we can create appropriate segments in these cases.
Now that we have two segments, we can look at them separately, together, or in addition to "all users" if we want aggregate numbers in our reports. This technique of using segments will allow us to see differences in behavior between different clusters of users.
Some Google Analytics reports that may be worthwhile to look at with the segments applied are:
- eCommerce
- Goals
- Product pages
We can use segments in a different way as well. We can look at our Site Search data with other segments applied. Some examples of segments that might be interesting are device, country, language, gender, and acquisition dimensions such as source or medium.
Dimensions
In addition to using segments, we can add Search Term as a primary or secondary dimension to other pages. Some interesting pages to add to are:
- Secondary dimensions on Product Pages: What did people search for vs. what did they purchase.
- Secondary dimensions on Landing pages: See on which pages users performed their site search.
- Adding other secondary dimensions: Add to your search reports to see if you can find patterns between search terms and other Google Analytics' metrics.
- Flow reports: See this blog post for how to look at Behavior Flow reports with site search.
- Custom reports: This might seem obvious, but we can create custom reports using site-search data, and combining it with other available metrics to give us a report with all the information we want in one place.
Get Comfortable with Site Search
There are plenty of other interesting questions that we can answer using site search. Play around with these reports, and start thinking about how we can use what's available to answer other business questions.
Keep in mind that site search is a great optimization idea source - if we get more users to search, we get more insights. If a lot of users use site search, this might imply that our website is not easy enough to navigate without searching. Or it might imply that our users come to our site for something very specific, and finding it is made easier through site search. These reports and search-related dimensions allow us to better understand our users and make changes to our site to better serve our potential customers.
