Core Web Vitals Complete Guide: Page Experience as a Ranking Factor
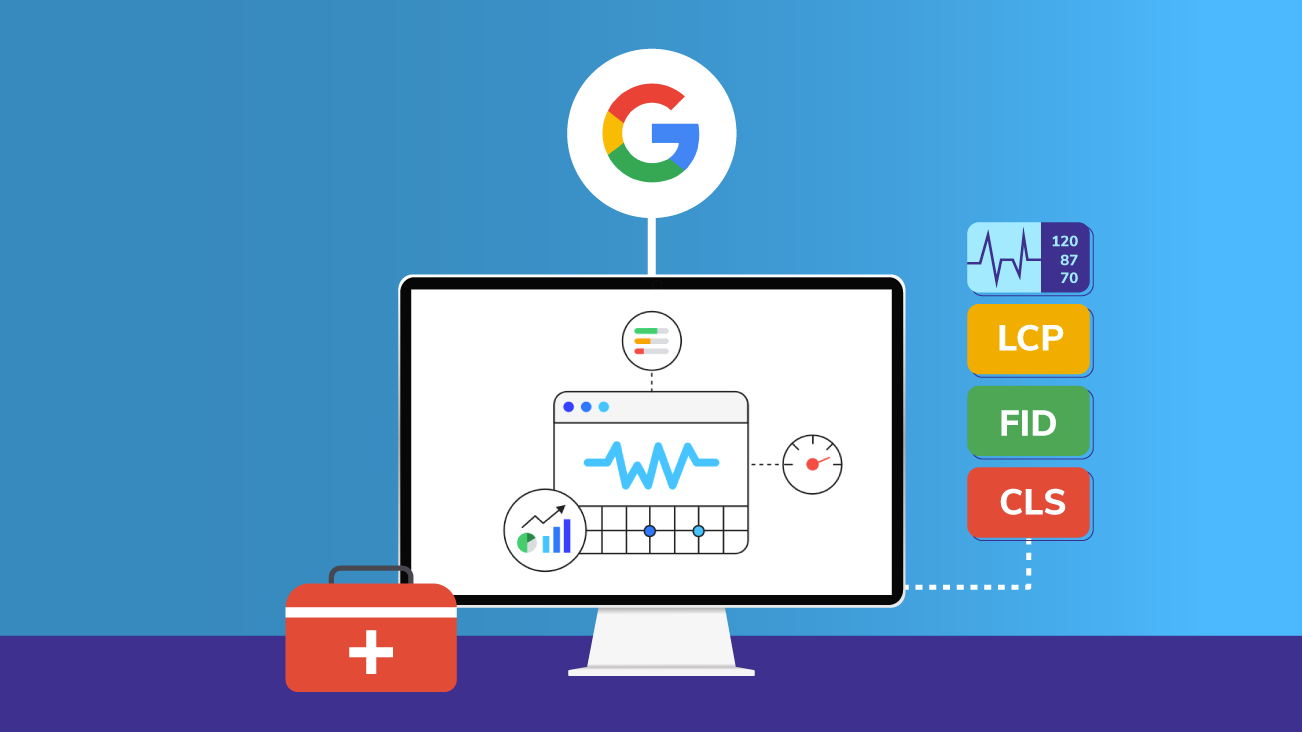
Core Web Vitals are integral elements when assessing website performance. As the name suggests, these are central, user-experience metrics that Google collects to assess overall domain health.
The metrics are computed from Chrome's user data of session timings taken from users' traffic to your site. The data is collected in a large BigQuery database by domain and maintained by the Chromium project.
There are three Core Web Vitals Metrics:
- Largest Contentful Paint (LCP)
- First Input Delay (FID)
- Cumulative Layout Shift (CLS)
Table of Contents
Why Are Webmasters and SEO Analysts Suddenly Very Interested in Core Web Vitals?
What Do You Get From Having Good Core Web Vitals Scores?
When Will Core Web Vitals Be a Ranking Factor?
What Are the Benchmarks for Core Web Vitals?
What Does Core Web Vitals Mean for the Future of Search Engines?
What If My Site Has Poor Core Web Vital Metrics?
Mobile Core Web Vitals Is a Ranking Factor
Tips on Addressing Common Core Web Vitals Issues
Ways to Overcome Common Issues Around Core Web Vitals
Reports on Core Web Vitals
Preparing for The Future of Page Experience
Why Are Webmasters and SEO Analysts Suddenly Very Interested in Core Web Vitals?
Google has confirmed these metrics will be ranking factors in its Page Experience Update that will be released in May 2021. It has been hinted at and was finally announced in November 2020. The specific metrics around mobile Core Web Vitals will be ranking factors.

Source: Twitter.com
It's rare for Google to announce a change to its algorithm. It made a similar look-ahead announcement with the Mobile Speed update in July 2018 as a way to provide webmasters with advance notice and the time to make changes. Since we know when it will be a factor, we have time to prepare our sites to take advantage of the change.

Source: Twitter.com
Most times, Google does not provide notice for core algorithm updates. This is why the Page Experience Update has gotten unique attention. When Google says "fix these specific things to see rankings changes and do so in the next couple months," the SEO world takes notice.

Source: Twitter.com
Google will reference the mobile scores as ranking factors according to notices we have seen. This does not mean you should neglect your desktop scores. On most responsive sites, solving for both is ideal and will likely develop the ideal mobile experience.
There have been other ranking factors rolled out in the past, but this looks to be a much further reach beyond mobile speed or basic content layouts. These are calculated metrics that are very well documented. This is not common for Google's ranking algorithm, and with this much lead time.
The overall effect on page experience is to establish what is best for users and how Google can be more helpful in providing safe and accurate search results. So, this is not exclusive of other page-related metrics like security or mobile page speed. It's another layer on top of those.
If you don't have a solid foundation, it will be hard to expect Core Web Vitals to give their full effect on organic search performance. Other signals for page experience include security (HTTPS), mobile-friendliness, and intrusive pop-ups.
These can greatly affect a user's perception of the trustworthiness of your content. It can also have other effects relating to the EAT (Expertise, Authority, and Trustworthiness) signals of your site. This is a larger umbrella that covers various aspects of how the user experiences your site's content.

Source: developers.google.com
When will those performance updates be reflected? And when will changes made to your site be reflected on reports?
It takes a while.
It's dependent on the page and the issue as to when that could happen (looking at timeframes). Most changes are reflected in the Search Console reports in about two weeks. A few factors such as the overall size of the site and the number of pages affected by issues could impact report timing. These time frames are based on the number of user timings that the CrUX database collects.
It can be harder to see changes on these reports with lower traffic pages. According to the official notices when you submit in Search Console, they also comply with the 28-day rotating cycle as the CrUX data becomes updated. In our experience, it can be sooner if you have enough traffic hitting the page and if the issue is easily resolved.
What Do You Get From Having Good Core Web Vitals Scores?
The proverbial carrot that Google is dangling for reaching all these milestones and performance requirements is special badging on the results page. Which is nothing to scoff at, Google has been testing badging for different sites for a while now and it's always good to dress up your results listings since it normally attracts the attention of a skimming user which leads to better CTR (Clicks Through Rate). An official Google badge can make a big difference on the results page since users would notice it and know it means "trust" in the site's content.
This is also said to be a ranking factor. Google has used many metrics-based ranking factors on the page including PageRank and RankBrain updates. This is one set of UX-related metrics that seem to be a portrait of where the web experience is going.
We know that based on recent changes in the algorithm, good UX principles with strong content, and clear page structures are always a good thing. This includes accessibility and other features around how sites are being marked up for screen readers. All these additional improvements around making your content available to all users are a hallmark of the last few major ranking updates that were announced by Google.
This has led to a lot more care being put into how the site performs beyond page speed. In the long term build-up to Core Web Vitals, it reminds one of the time when page speed was king and we did everything we could to get a fully loaded page in front of a user as quickly as possible.
Page speed has often been touted as a ranking factor by the SEO community. We do know that in July of 2018 Google announced mobile page speed as a ranking factor. It's a direct ranking factor but the extent of how powerful it is can be subjective. With a variety of connection speeds and devices, the overall page speed can change based on many factors.
When Googlebot renders a page to evaluate the experience, it does so from a server and with a strong connection. Instead focusing on strong content and a simple visual experience have shown to improve ranking, where we often see fast pages are getting more clicks (increased CTR and less bounce) but, not necessarily jumping in rankings once the page loads in an acceptable amount of time.
These Core Web Vitals are testable metrics for each page and different aspects of the page which will make this much more cut and dry than the previous performance-related metrics. This is also confirmed to be a direct factor. Meaning, Google has told the webmasters of the world that Core Web Vitals will be a ranking factor and it will focus on the mobile experience.
When Will Core Web Vitals Be a Ranking Factor?
Even though these are confirmed ranking factors, they will likely be rolled out over time. Many Google updates can happen in a year. As to when this does become a ranking factor (meaning when the algorithm is updated to reflect this metric in ranking pages for organic search), there was an announcement it would be in May 2021.
It does not mean that May 1st is going to be the rollout date and there could be many algorithm updates in that month (so prepare for fluctuations and traffic swings).
Smart webmasters will take action before issues arise. It's also advantageous to go into May with a clear head that there could be a lot of changes. It will all work out fine if your website has been properly prepared for this new ranking factor.
What Are the Benchmarks for Core Web Vitals?

Source: web.dev
We also know that all minimum Core Web Vital Requirements must be met for a "ranking boost" according to Google's John Mueller. This means the following must be present on your site according to PageSpeed Insights tests:
- Largest Contentful Paint (LCP) Under 2.2 seconds
- Cumulative Layout Shift (CLS) less than 0.10
- First Input Delay (FID) of 100 ms or less
The first two (LCP and CLS) can be controlled on the front end of most CMSs or site architectures. The FID score is heavily related to having a good backend and server architecture in hosting and operating the site.
What Does Core Web Vitals Mean for the Future of Search Engines?
It's also important to note that where Google leads, others will follow. The competing search engines like Bing, Yandex, and Baidu will take notes from changes on Google's evaluation of web content in the future. With changes around passage indexing, Core Web Vitals, and Natural language processing, we will likely see tools and updates to other search engines with similar goals.
We have seen that many of the users of other search engines will still look for high-performing websites to be included in their results pages. The other search engines are likely to create their own versions of how these relate to their platforms and algorithms. It's not likely it will be quick. We do know that being early on ranking factor updates like this will give a competitive advantage in industries where large platforms and sites take much longer to pivot and work towards SEO-related goals.
We have worked with numerous clients who give us an advantage in creating nimble sprint goals to complete updates to key page types and establish strong Core Web Vital scores before May. This is hard to do with large development teams and coordination between many stakeholders. Using our co-innovation style partnerships, we have developed a series of quick checks that helps our clients work towards these goals.
As of February of 2021, a Chrome UX Report from Google showed where many brands were in relation to Core Web Vitals. Here are the average ratings for the 8,185,540 origins (domains) that are currently being tracked by the Chromium project:
- 47.81% of origins had good LCP
- 89.28% of origins had good FID
- 50.25% of origins had good CLS
- 23.71% of origins had good LCP, FID, and CLS
If this is showing us anything, it should be noted that over 75 percent of sites are not reaching the minimum thresholds for ranking boosts and potential badging. This should be a sign that it is likely an advantage to be prepared.
What If My Site Has Poor Core Web Vital Metrics?
It's hard to tell but, with over a year of notice, it will possibly be better to take steps to address these since it will likely have a profound impact. Since these are UX-elated calculated metrics, they are also visual and noticeable to a user. So, if many sites are accounting for these issues, it would be a competitive disadvantage to be behind competitors.
Your site can easily begin to appear older and less responsive in comparison to others in your industry; it would be best to take action even if you are late for the May launch. The laggards, after this has been a ranking factor for a year, will likely feel the effects early on and with greater salience over time.
This is not all doom and gloom as this is a great time to refresh your site and optimize the performance as we prepare for the "new normal" post-pandemic. The transformation to digital has been accelerated in many industries. This is an opportunity to make in-roads on entrenched competition and to develop new ways to generate awareness or leads away from the trade shows, events, and other avenues that many industries relied upon before the pandemic. Using this new ranking factor as a catalyst could foster a new perspective on how to use the internet presence of your site as a channel for expansion of many business goals.
Mobile Core Web Vitals Is a Ranking Factor
Mobile experience has been around for a few years now and mobile-first indexing has been our norm for that time as well. We are no longer a "desktop-or-die" experience, and our ranking on the results pages depends on solid mobile experiences. This is taking all of these factors into consideration and turning it up to 11. This is the time when laggards on updating their web presence see insane drops in traffic and large position slides further back towards position 100 or deindexation.
Having a mobile-friendly responsive site is not just about media fitting device width and readable text on a mobile viewport. We now need to understand how the different elements are loaded to the page and to make sure the full experience of the page's content is loaded in a timely manner.
No shifting paragraphs when hero images load anymore, we are now looking at a complete experience from when the user hits the page. This is where UX, content, design, and development all meet around SEO. It takes a series of stakeholders to work closely together for strong brands to take advantage of these changes in Google.
To help webmasters, content specialists, designers, front-end developers, and even fellow SEO teams prepare, Bounteous has created dashboards using Google's CrUX (Chrome User Experience Report) information.
This is a great tool for investigating large site-wide issues as well as an easy view to assess if large-scale changes have negatively impacted Core Web Vital metrics. The best tip for using these is keeping the "Month" drop-down and using it to look at releases and when additional errors appear on specific metrics. It will have you spending less time tracking and more time tackling. Just look into historical sprints to see if a change affected the metric. Then, look at release notes with the development team to uncover what caused the shift.
We often start with the stock Dashboard and build our own visualizations to help our clients address complex challenges. Since this is also direct data from the CrUX BigQuery data that Google collects on page timings, it takes around 28 days for the data to cycle into this report. So, this report will be looking at month-to-month changes primarily. Customizing it can ensure the specific issues are tackled from top to bottom based on priority.
The dashboard is also helpful for other teams to see how the site is progressing. Everyone likes to see the success of their efforts when working on the project together!
Tips on Addressing Common Core Web Vitals Issues
Here are a few tips and hints to help you decode some common issues we've seen:
LCP Issue
We want to see the large media files (images, videos, etc.) load in under 2.5 seconds. These issues commonly happen when the hero images on pages are not the right size or not compressed. It can also be beneficial to lazy load any images that do not need to appear "above the fold."
In many cases, even correctly sized JPEGs tend to be uncompressed and rather large. Don't forget that using a JPEG where a PNG was can also help reduce file sizes. LCP issues stem from large media files and images are almost always the case. Assigning priority to load images faster can solve this issue.
Another option is to use a static element to hold the space that the image will appear in. This prevents further issues with CLS from your LCP issues. In some cases, using a responsive CDN or DAM can help address image loading issues on a large scale. However, it will require site-wide restructuring of all image content. Using functions like browser hints can give a higher priority to the images called to the page.
CLS Issue
An error on CLS score is .25 and greater. We would ideally like it to be .10 or less. In many cases, it seems that when the top of page elements load, it pushes other objects down the page. This can occur if a hero image does not have a container div element and the size of the image pushes elements below the fold as the page loads. This is commonly related to the LCP issues for large hero images. Fixing one could fix both Core Web Vital issues. This could also be based on page templates and might require further research.
Other CLS issues are harder to track down and many can also be fixed by adjusting the priority of specific elements in the main thread of the page load. Shifting elements during page load can be investigated through PageSpeed Insights and Lighthouse audits. Look for elements that are moving between rendered images in the load sequence.
Apply static sizing or give elements higher priority in the main thread load sequence to resolve these issues. Also, ensure that page templates across page types are consistent with updates to address CLS issues. Fixing a single page when a series of pages use that same template can cause more harm than help on these metrics. Ensure that the changes resolve all issues across the pages that use that template or style.
FID Issue
The ideal time for FID is under 100ms. That's pretty consistent for most dedicated hosting platforms with a few exceptions. One overlooked issue is the server location and where you are testing from. If you have a server in London but are targeting US-based users, you could likely have added delays.
The same can also be said for servers with relatively poor performance. This metric will likely have a significant impact on sites with shared hosting platforms with other applications or shared hosting services (like GoDaddy). If there are issues with FID, first look at page speed testing your site from multiple locations. Tools like WebPageTest are great for looking at server delays based on location.
Examples of Addressing Issues on Key Pages
Since Cumulative Layout Shift (CLS) is the hardest to track down, we have an example of how we would address issues on a key page. In doing this, we evaluated a series of homepage experiences for a variety of industries. We found an example with clear evidence on how to address the issue.
Here is an illustrative example of the CLS issue on the homepage of Edible Arrangements:

Created at defaced.dev
This issue scores a 1.39, which is a very high score. It seems to center on how the large image of the "boxes" deal banner is loaded in the upper part of the page. To address this, we will want to load the banner sooner in the main thread. We will also want to check the sizes of these image elements. The main goal would be to create a seamless page load that is stable during the users' experience. Here is the rendered page images timeline from PageSpeed Insights:

Source: developers.google.com/speed/pagespeed/insights/
It's clear to see that during the page load the banner and the large image in the carousel are pushing elements around on the page as it loads. These images are likely not optimized for this display and are creating a series of issues since the page is so image-heavy.

Source: developers.google.com/speed/pagespeed/insights/
These issues can often be minimized by adding a fixed height <div> element around the image. It also stems from images that load slowly and push other elements once it seemingly spontaneously appears.
There is also an LCP issue that can easily be resolved by resizing and compressing a few above-the-fold components. Using both of these tools, we have a good idea of where to start in tracking down the elements that have created this issue with the visual stability of the page.
This could be related to how additional features are added to the homepage. If this is an "added" feature from the CMS, we will want to see how these images or resources are being handled by the CMS, CDN, or DAM to likely resolve other issues.
Ways to Overcome Common Issues Around Core Web Vitals
Use the Google CrUX dashboard for a high-level overview of issues (check all the pages in the default report in Data Studio, many pages beyond the first few have insights and worthwhile data).
Create specific visualizations for key errors or issues and prioritize in the dashboard layout (Page 1 top issue, page 2 second issue, etc.).
Use Search Console to find specific page issues (and related pages).
Solve for key pages with PageSpeed Insights in real-time.
Check all pages in the navigation menus on your site (header and footer) regardless of reported errors or issues (all minimums must be achieved for the ranking boost!).
Use web.dev/measure to get some high-level changes to improve scores and overall speed (mobile page speed is a ranking factor).
A lot of the issues can be caused by oversized hero images above the fold—resize, compress, and check your div sizing for those elements first.
Tackle LCP issues first to get them in the hands of designers or creators to edit, compress, or optimize (the majority are image-related).
Work with dev on CLS issues and assign importance to above-the-fold content in the loading of the page.
Check out our competitive CrUX monitoring dashboard to pull insights on changes competitors as well as your domain (Copy the DataStudio dash and you can edit it!).
FID issues have a lot to do with your server and overall architecture.
Subdomains separate domains on CrUX reports, check Search Console by the property for subdomain-based sites.
Subdirectories/directories can not be broken out in the CrUX dashboard since it is all by domain(s).
Tracking down CLS issues is very difficult, use a tool like defaced.dev and PageSpeed Insights to get a start.
Reports on Core Web Vitals
Now we can talk about the kinds of reports that give insight into what needs to be fixed and ways to track down where changes need to be made.
There are numerous reporting tools available and ways to debug them. It's recommended to look at multiple sources since some are better at certain things than others. There is no signal source of truth since we have not had a chance to test these page ranking factors "in the wild."
After the ranking factor is released and we're seeing the changes in the results pages, we will then have a better understanding of a single report that will best address the majority of the Core Web Vitals metrics.
Core Web Vitals Reports In Search Console
Information around a domain's Core Web Vitals can be found in Google Search Console. The reporting found in Search Console is most useful when analyzing page-by-page errors that could be affecting overall site metrics.
Google Search Console will also give a listing of "poor" performing pages and "needs improvement" pages for each metric type.
There are reports for both "Mobile" and "Desktop," with page counts based on performance. These reports can help identify pages that have specific errors. If a change has been made to a URL, Google will need to crawl and compile user timings on the page to see the changes and update them in the report.
Here are some screenshots of the Search Console report:

The Core Web Vitals Search Console report was launched in May of 2020 (almost exactly one year before it will be a ranking factor). The report is located under "Core Web Vitals" on the left-hand main menu when you are in a property.
It's worth mentioning that these errors and warnings are grouped on related pages. When you click into an error or to look at URLs that need improvement, you will need to click on the link item (which will have an example URL listed) to see the other URLs that could have similar or related errors in their scoring.
These reports are generated by user timings. This report and the other reports need to have enough traffic to provide data. The version of the report in Search Console does have specific pages. This report will also allow you to submit for validation. This will help flag issues as resolved for when Google is recrawling those pages and collecting user timing. The same rotating 28-day cycle does apply to this data but we have seen resolved issues removed from this report in as little as two weeks.
This report will be most useful in tracking down specific issues and working on those issues. This can also highlight pages that could be in a similar template. It's good for finding specific issues that are outside of the minimum value. It's more effective on a page-by-page level. There are other ways to look at how Core Web Vitals interact with other page load factors and getting a "from the source" version of the CrUX data.
Using the CrUX Dashboard
This is the reporting from the CrUX Dashboard that can be built in DataStudio:

Source: g.co/chromeuxdash
The CrUX Dashboard was released by Google in May 2020. This is directly from the BigQuery database that organizes the user timings by domain. So, a subdomain can be created as a unique dashboard but if a part of the site exists under a directory structure, that will be within the root domain.
This also does not show page-level data. It would still be recommended to use this report since there are numerous helpful data sets. Some great insights include device connection types (4G, 3G, and slower as well), first contentful paint times (averages across user timings), and DOM content loaded times.
This is very helpful for a few reasons.
One is that it can be great for getting competitive insights from your main competitors. This can easily be spun up for any domain. It would be good to see if your competitors are taking steps to address Core Web Vitals.
The second key insight from this report is looking at a variety of page speed factors from their data. So, when we talk about mobile page speed being a ranking factor, this dashboard allows you to get an idea of where your sites stand based on the CrUX user timings.
Using PageSpeed Insights
This is the tool for testing a page in real-time.
When you're making changes, doing numerous checks on your staging environment (if your environment allows robots) will be key in fully taking advantage of these metrics. Since the score can depend slightly on when the page is fetched, it's important to test before and after releases with more than one tool. This tool in particular will not save your test (fresh fetch every time it runs). Keeping a tab open with the test can help in comparing before and after.

Source: developers.google.com/speed/pagespeed/insights/
This shows the Core Web Vitals scores (stats with the blue banners) for each fetch. There is also a render of the progression of the page load. This is very important for addressing CLS issues.
There are very few tools that help with CLS issues like PageSpeed Insights. Not to mention it is Google's tool and they are the source for this kind of metric.

Source: developers.google.com/speed/pagespeed/insights/
As a note on this specific PageSpeed Insights test, notice the CLS score is almost zero since the LCP issue is related to the oversized image above the fold but the static background div element keeps the layout from shifting.
The opportunities on the PageSpeed Insights report are very useful. It would be worth mentioning this is not always "all the answers" to your Core Web Vitals or page load issues. It's a good starting point. Some changes require an experienced developer who understands your CMS or codebase. There are very few sites that will achieve the ideal scores without specialized help.
Preparing for The Future of Page Experience
If you've made it this far, congrats. It means you're a webmaster who is curious and interested in the changing landscape of search. We hope that you honestly evaluate your website and how prepared your domain is to exist in a world where Core Web Vitals matter.
Take time to reflect and note those areas where you can improve your domain. Flag those issues, work with your development team and be prepared for Google's updated algorithm. Don't give up even if you miss the May 2021 deadline. Improving Core Web Vitals is not a one-time activity; it'll be part of SEO's jobs from here on out. Expect to see further additions to how they are evaluating pages and Bounteous will be sure to keep you informed as these changes roll out.
This is an exciting new direction for the internet and a step forward in making the web better for users. As we grow more reliant on search engines to help us navigate our lives, we will appreciate the usefulness of these metrics to make search results more helpful. It all starts with us working together to better present our content and being prepared for the future of the web.