Three Simple Ways To Improve Your Competitive PPC Strategy

No matter your industry, every business has competition and a running list of competitors. If you have invested in paid search advertising, you probably have seen multiple websites that sell a similar product or service.
However, did you know that competition can affect certain aspects of your paid search performance? Including expensive CPCs or your ad position within the SERP (search engine results page). By definition, paid search is a highly competitive space as companies enter an auction system to be ranked onto a shortlist of ad units that prospects and customers will ultimately see and engage within search results.
In my experience, having some ideas of where to start when it comes to analyzing competitive metrics can be extremely helpful. Also how to take it a step further and build a proactive competitor strategy. Let's cover the importance of frequent general competitor analysis then dive into three key analysis types: position analysis, mobile analysis, and Shopping ad analysis.
Constant Competitive Analysis Will Help You in the Long Run
Starting off with some blatant advice—I have found success while managing paid search accounts by ensuring I always knew:
- What competitors are continuously bidding on our brand terms—and if there is any seasonality involved.
- What competitors are constantly outbidding us.
- What competitors have a better message or offer than we do.
You can learn and memorize these by simply checking in on a regular basis. Use a mixture of the Ad Preview Tool in either Google Ads or Microsoft Ads and check in on your Auction Insights. Take it a step further by looking into seasonality trends. For instance, if you are a commerce business, you probably see a difference in competition on Black Friday than you do on a random Tuesday.
If you can recite your competitor's high-level performance in relation to yours, you will be in a better place when it comes to building a proactive strategy against them.
What It Looks Like to "Check-In" On Your Competitors
Let's walk through the type of check-in that I am talking about. You can make this quick and easy—I usually do this on a weekly or biweekly basis.
Starting with the Auction Insights report. The key metrics I pull out:
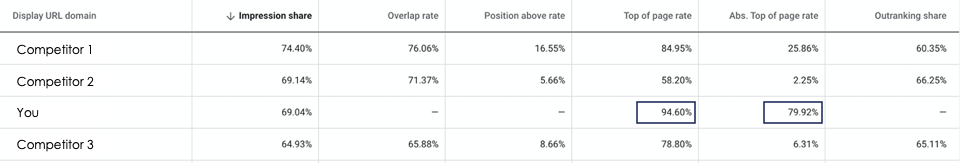
First, I look at my own data. Here I can see that I'm in the first position 80 percent of the time, and I am above the organic listings 95 percent of the time. I have some room to bid more if I need to, but overall I am doing really good when it comes to visibility.
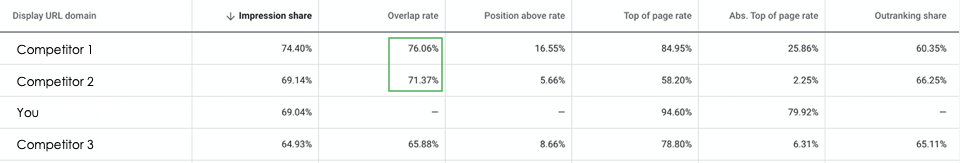
I will look at the overlap rate next. In this case, I see Competitors 1 and 2 are in the same auction as me over 70 percent of the time. I can assume that we are bidding on the same keywords for the most part.
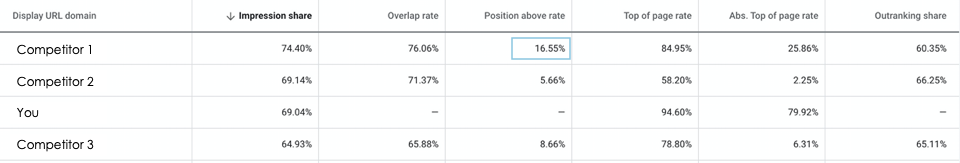
Looking more into Competitor 1, I can see that they rank above me 17 percent of the time. Now I know why my absolute top of page rate is around 80 percent—I am mostly losing to this site.
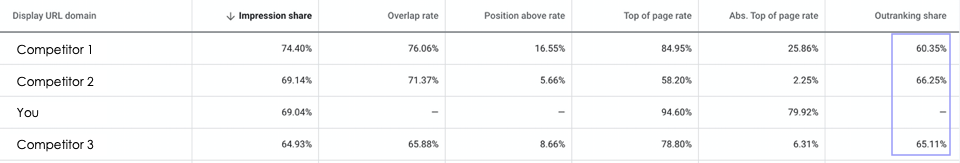
Finally, I will look at the outranking share and see that we are outranking all of the competitors for over 60 percent of the impressions. I am going to memorize this number and use it as a benchmark. I never want to fall lower, but I have a goal of getting that percentage higher.
From here, you can use the Ad Preview tool to look at the SERPs in real-time. I love doing this to see what competitors are messaging in their ads. You do not need to go overboard, just check in every now and then. After a while, you will start to memorize their patterns.
Just remember, you will never know your competitors' bids or budgets—and that's okay. However, you can make an educated guess based on the metrics the engines provide. You can see the percent of time they share an auction with you. You can see how much they outrank you. Use these metrics to make an estimate based on your own bids and budget. I am not saying to estimate an exact number, but you can figure out who is spending a lot of money with a search engine and who is not.
Make it a habit to check in on the data, figure out your personal benchmarks, and memorize them.
Ad Positions and Competitive Advantage
To build a successful strategy based on ad positions, there are two main metrics you need to be monitoring: Top of Page Impression Share and Absolute Top of Page Impression Share.
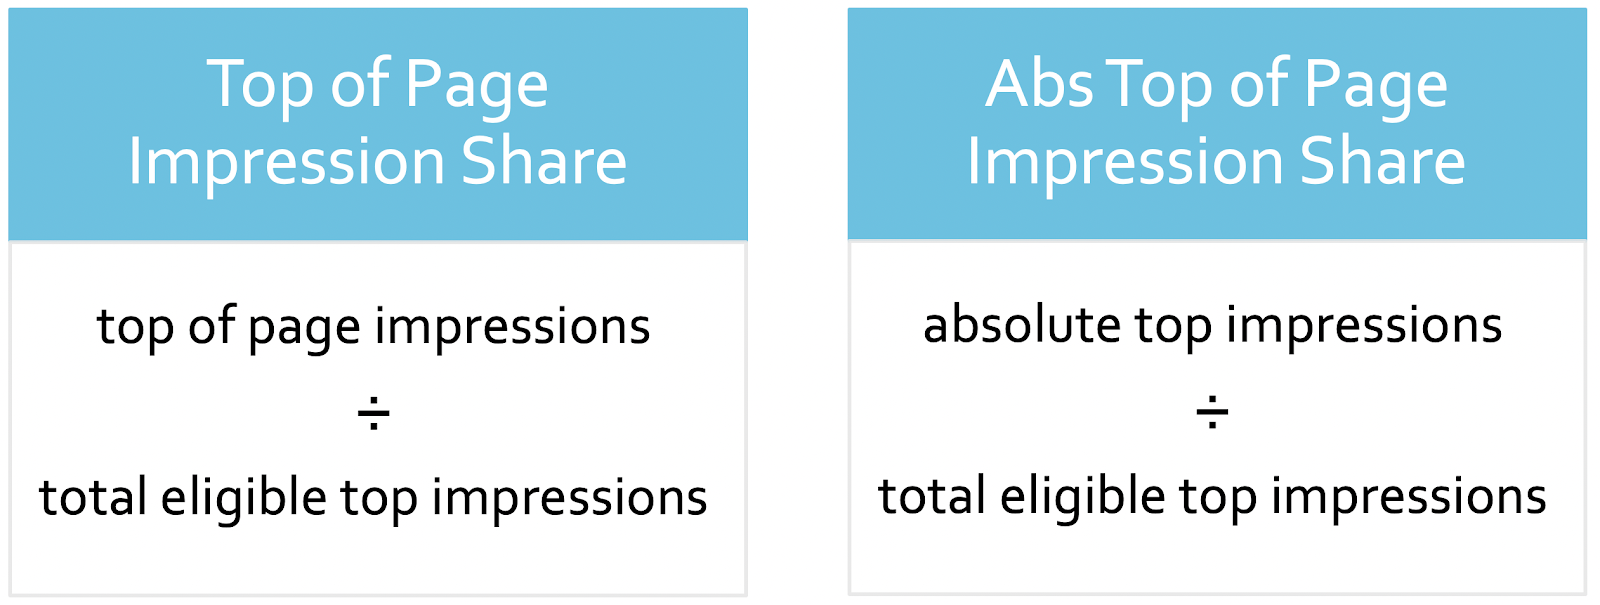
These are not in the Auction Insights report, but are still essential because they help you see where your ads are physically ranking and how often you are appearing in those positions out of eligible impressions. Ultimately, where you rank can give you a competitive edge.
I know there are some paid search marketers who are okay with appearing lower in the search results because they know it is cheaper. That is perfectly fine if that fits your budget and multi-channel strategy. However, 1) if you really want to gain traffic from a set of keywords, 2) you need to defend your brand search results against other sites, or 3) you need to gain traffic from mobile searches. This is one of the most important things you should focus on when it comes to a competitive strategy.
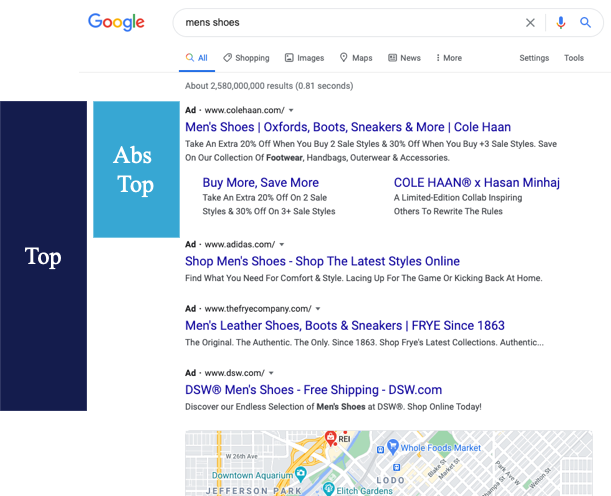
How This Looks in the SERP
Just to make sure we are all on the same page, here is where you would see an "Absolute Top" ad versus a "Top" ad within a search results page. You can see the Top includes the four-pack of ads that appear above the map result. Absolute Top is the very first ad. On a desktop, the first ad usually gets more space and their site links will show.
A couple of years ago, this was a bidding game where you would have to constantly come in and check your average position and up your bids in increments. However, now both Google Ads and Search Ads 360 offer automated bid strategies that help you dominate either position with a percentage of your choosing. I have used the bid strategies in both UIs and have seen excellent results. Most importantly, they have given me peace of mind that we will not lose our ranking over the weekend or during a crazy time like Black Friday.
But What About Mobile
As we all know, users are turning more and more to their phones to perform searches. Marketers need to keep up and consider this screen size with their paid search strategy—especially if your goal is to outrank competitors.
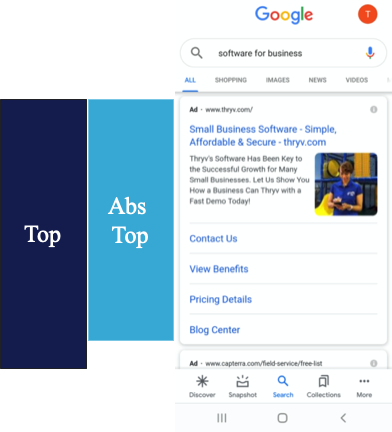
Below is a B2B search on mobile. You can see that the first ad, or Absolute Top ad, is really the only one that shows. This makes this position even more important and something worth considering when you think about your competitive strategy.
Now if we go back to our "mens shoes search," but for mobile—you can see this is a different ball game. In this case, the Shopping ads are the ones that appear first and take up the entire screen. If the user scrolls down, that is when they get to see the first set of ads. Below that is a map of nearby stores. THEN there are organic listings. In this case, if you want to appear in that initial view, you would need to look at the competitive metrics for your shopping campaigns and work on those bids.

How to Analyze Shopping Competitive Metrics
If I wanted to dig into my competitive metrics for Shopping, I would follow the same steps as we walked through above. Just note that Google does not provide as much insight as they do with search ads, but we can still make some assumptions.
Knowing that there are no keywords in Shopping, I am going to drill down to the product group I am most interested in and use those metrics to make an educated guess.
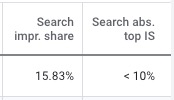
Starting with our impression share metrics, we are able to see that we are in the very first PLA position less than 10 percent of the time. And we can see that our shopping impression share is 15.8 percent. So overall, we have a lot of room to grow if we have the budget to support it. It’s a lot harder to be competitive in Shopping due to its nature, but you can still achieve a higher impression share for your core products.
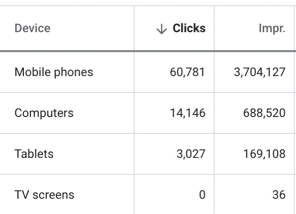
Then, we'd check our device report and see where our impressions are. In this case, 81 percent of our impressions are on mobile.
My final step would be to look at the Auction Insights report and see what brands we are competing against. If they are brands that share a similar consumer, I might use this information to get more aggressive with my bids—especially on mobile.
One Last Reporting Tip
To wrap this up, let's go over a different way to look at the data. If you are interested in seeing how competitive metrics trend over time, you can easily build this out in a couple of steps.
First, go to the custom report section within Google Ads. Add the metrics of interest, segment by day, and then download them into a spreadsheet. From here, you can build a pivot table and chart the data.
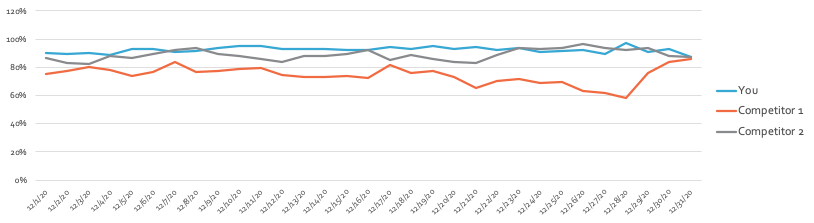
In the example above, I pulled the Top of Page Rate by day. We can see that our website and competitor 2 are consistently competing in these ad spaces. It also looks like I never had a dip below 80 percent—I can make 80 percent my benchmark moving forward.
However, it is hard to ignore Competitor 1 in this chart because they recently shot up and joined us at the top of page section. This alerts me that I need to be looking out for them because there's a chance they changed their bidding strategy or obtained more budget. This means, my competition is not just with one site anymore, it is now with two.
Quick Recap
If you can dedicate two hours per week for these three spot checks, you'll be able to fend off competitors, rank your brand's ad in paid search auctions, and drive cost-effective new traffic and leads to your business.