Free Excel Workbook For Analyzing Screaming Frog Data
– A cleaner style that makes reading the dashboard easier
– A new area in the workbook for outlining the top 5 takeaways from the data
– Better, consolidated visualizations makes spotting issues faster
– Space added to insert client logo
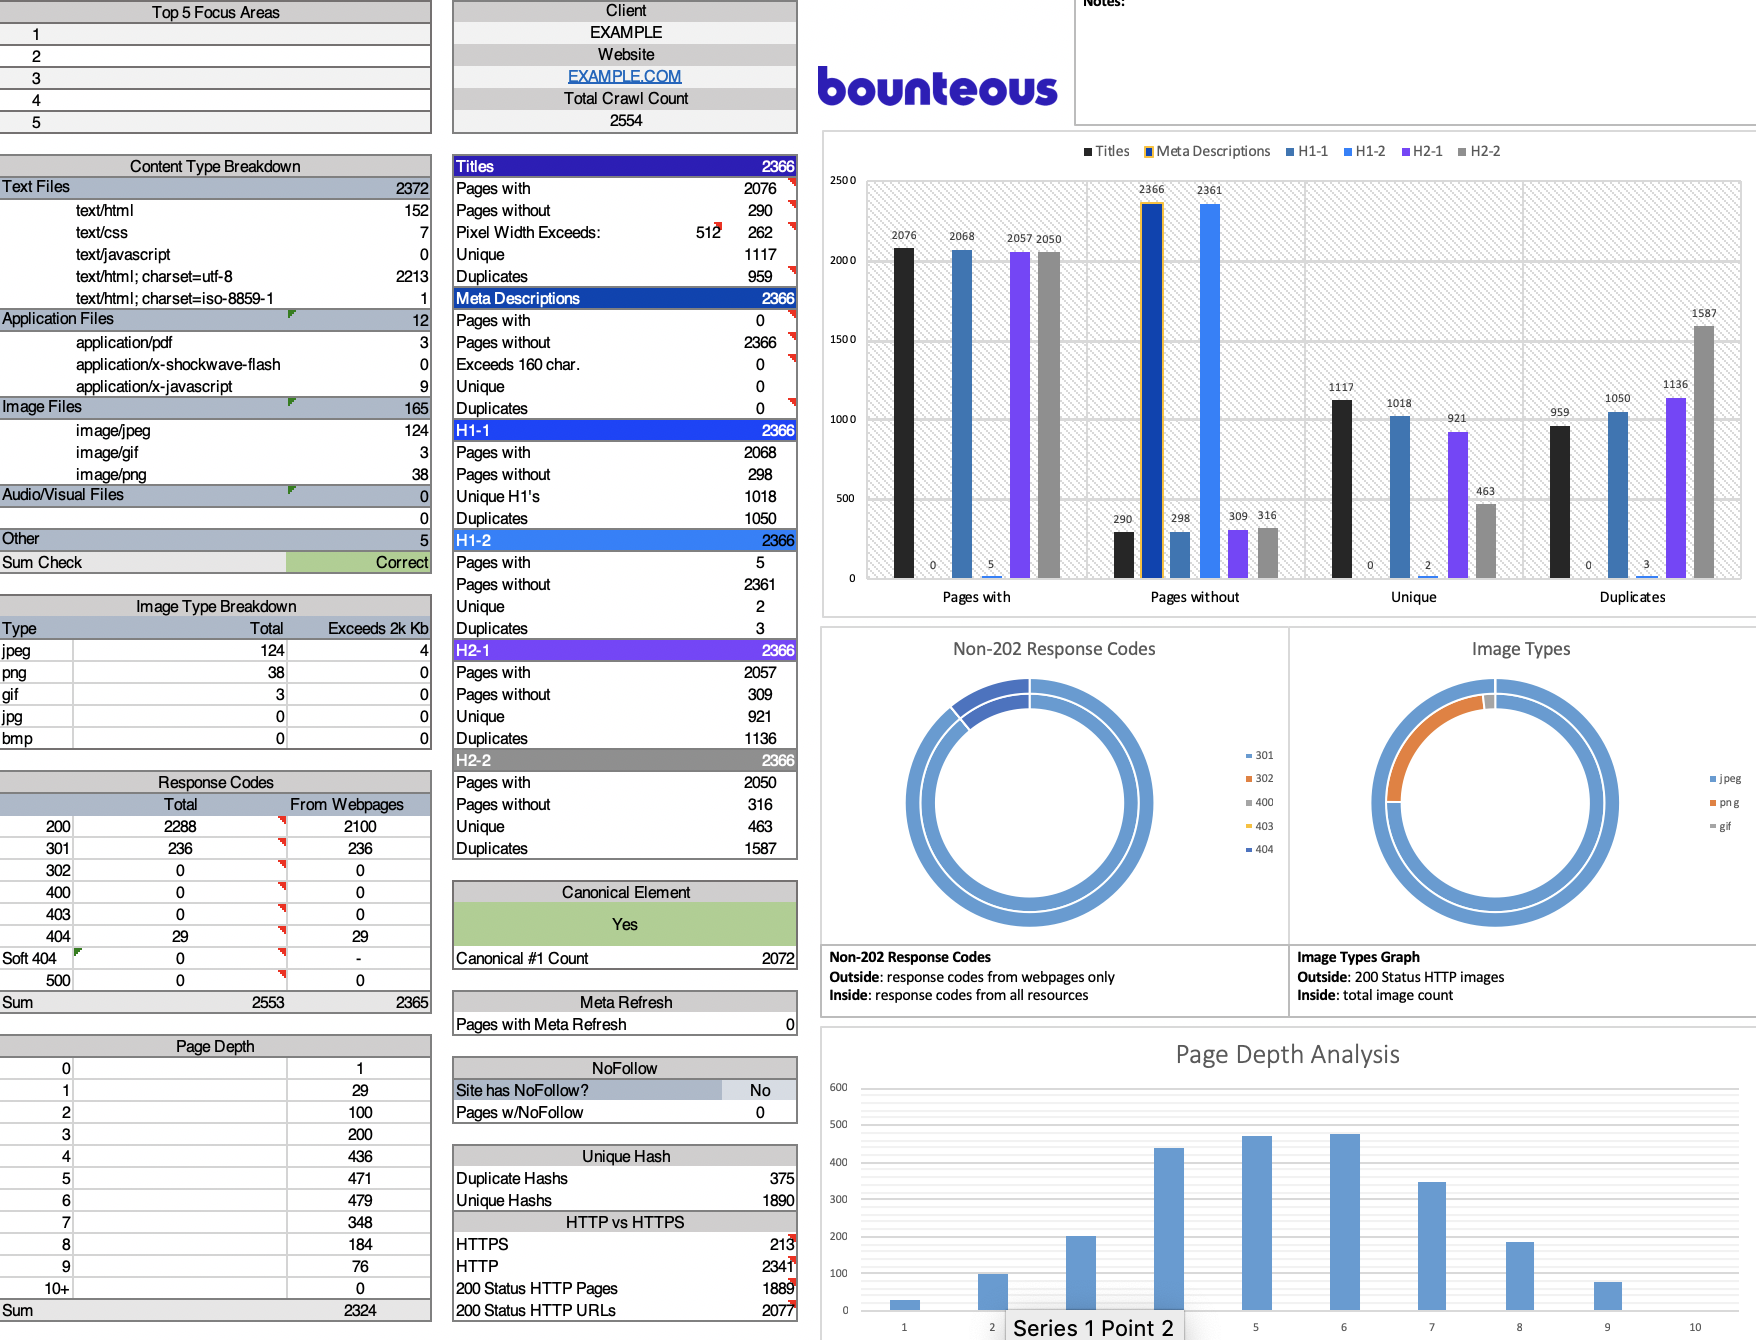
We here at LunaMetrics are born from data and to data we return time and time again to uncover insights and craft strategy. But staring at large sets of data is a mind-numbing process, one I personally hate. So when I began performing health checks for large websites I immediately starting thinking about how I could eliminate as much work as possible. Using some Excel magic, many Mr. Excel videos and data pulled from Screaming Frog I created a simple copy & paste workbook that counts, totals, and visualizes all the data Screaming Frog gives you.
Shout out to Dan Sharp of Screaming Frog for his great feedback on this workbook. Keep an eye out for Screaming Frogs new version being released in the next couple weeks. The big addition? Data visualization. Can’t wait for that!

How It Works
After crawling a website with Screaming Frog, export the data into one of the three available file formats (.csv, .xls, or .xlsx).
Copy all of the data from the Screaming Frog worksheet (starting in cell A4) into cell A2 of the ‘data’ sheet of this analysis workbook.
- The easiest way to copy all the data is to click cell A4, then use Ctrl + Shift + RIGHT to select all columns of data.
- Then Ctrl + Shift + DOWN to select all rows of data.
- Then use Ctrl + C to copy the selected cells.
- Go to the datasheet of this workbook and Ctrl + V to paste that data into cell A2.
- Pasting the data into cell A2 will align all the data with the column headers I already have in row 1.
If this data does not align properly, then there is an added or missing column of data which you will need to adjust for in the ‘data’ spreadsheet.
The Report Tab
The reporting tab is set up to make customizing this report for each website as easy as possible.
File Type Analysis
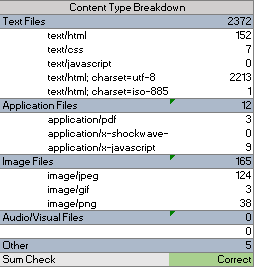
This section is made to be modified. Column C contains the file type you would like to count from the data pulled from Screaming Frog. Column D takes what you enter in Column C and counts the number of times it is present in Column B of the ‘data’ spreadsheet.
On-Page Breakdowns
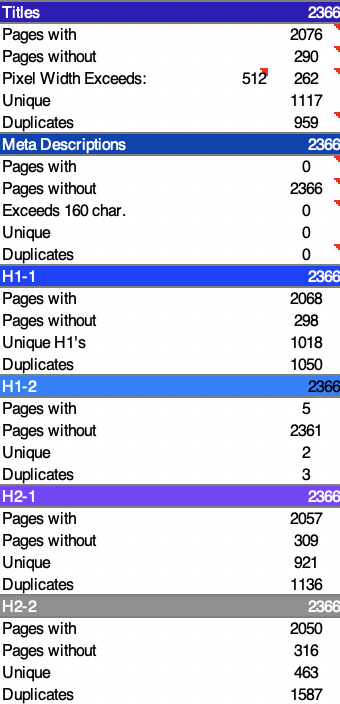
The section next to the file type breakdown looks at titles, descriptions, H1-2s and H2-2s. For each you will see the number of pages with the element, without the element, and how many unique and duplicates there are of each element.
Titles: You are able to change the max pixel width for this section. In the cell next to “Pixel Width Exceeds” enter a number you consider to be the max pixel width. I have 512px as the default, but I have also heard pixel width is actually more like 482px wide. I know there will never be a consensus, so I gave you control.
Image Breakdowns
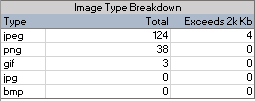
Like the File Type section, this section also allows for some customization. Just change the Type to whatever image file you’re looking for. The spreadsheet will do the rest. It will count how many of each image file were crawled and tell you how many of those files exceed 40kb. If you don’t like 40kb then feel free to change the 40 in the equation to whatever you like.
Response Codes
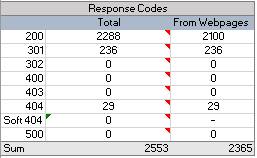
This table counts all the response codes and throws them into a nice graph so you can see both. Each code has a comment which includes and explanation of that code. As with previous tables, you can change the response codes if what I have included does not capture some of the codes on your site.
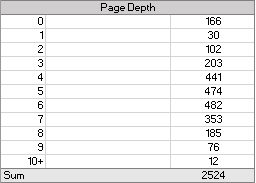
Page Depth
This section buckets and graphs the depth of pages and graphs it in a bar chart to the right. Great for visualizing where the bulk of your site resides.
HTTP vs HTTPS
Used in conjunction with other metrics in this sheet like canonical element counts and duplicate hash counts, you can judge whether there is an issue with HTTPS duplicate content (and if so how severe).

Duplicate and Unique Hash Counts
Every page that has content has a hash. This is a good way to look for truly duplicate content.
Update:
Jun-14
- Canonical Element #2 column removed from the ‘data’ spreadsheet
Having problems? Check out these great excel resources to help you solve them.
Excel is Fun with Mike Girvin
Mr. Excel with Bill Jelen
Disclaimer: You break it, you bought it.
