How To Report Items In Multiple Categories In Google Analytics
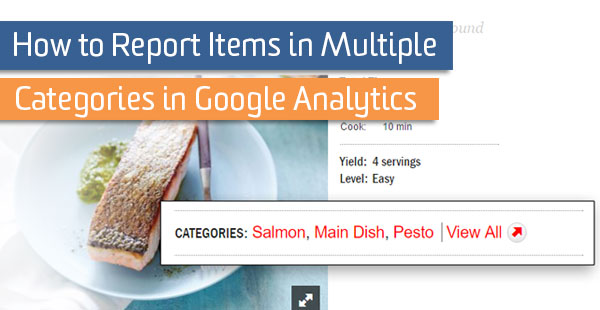
Google Analytics has many built-in ways to report on categories, unless you have individual items that each belong to multiple categories. Have you wondered what’s the best way to report on scenarios like the following?
- blog posts or articles that belong to multiple topics or have multiple authors
- product pages where the same item is related to more than one category
- events (user actions) that are related to more than one category, e.g. video plays
- forms with multiple checkboxes checked (product interest, program interest, newsletters subscribed, etc.)
If you’ve faced any of the above, and need better options for reporting, then this post is for you!
The Setup: String Categories Together in One Value of a Custom Dimension
If a blog post belongs to three categories, obviously you don’t want to send three pageviews, each with a different category. Instead, send a hit-scoped custom dimension along with the pageview of that blog post.
In your custom dimension, string the categories together with a delimiter like “|” or “:” – your delimiter can be any single character that doesn’t appear in your category names. TIP: For easier calculations, make sure you start and end your entire string with the same delimiter.
You’ll end up with values that look like this:
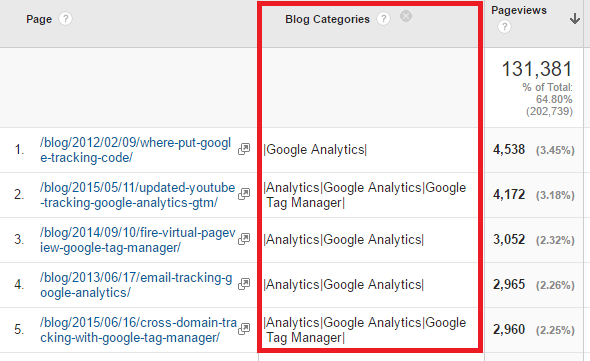
In the table above, the custom dimension “Blog Categories” displays all the categories for each post. Some posts might have only one category, while others have two or more. The important thing is that, for each pageview, we sent this custom dimension with all the categories together in one value.
Looking at this table, it appears you’re in a bit of a pickle. How will you report on the views of posts in each category?
Solution #1: The Dashboard
Do you have a small, known number of categories – let’s say half a dozen or so? A simple Google Analytics dashboard is perfect for this scenario.
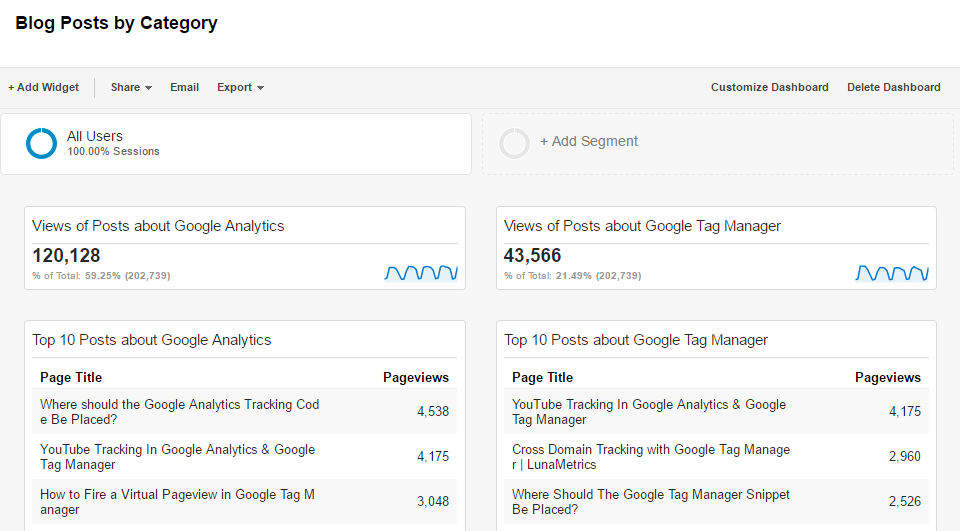
This dashboard has two types of widgets for each category: one that shows the total pageviews and one that shows the top 10 blog posts for that category.
In each case, the data is filtered using the custom dimension named “Blog Categories”. If you want to match a specific category exactly, just make sure you include the delimiter before and after the category name.
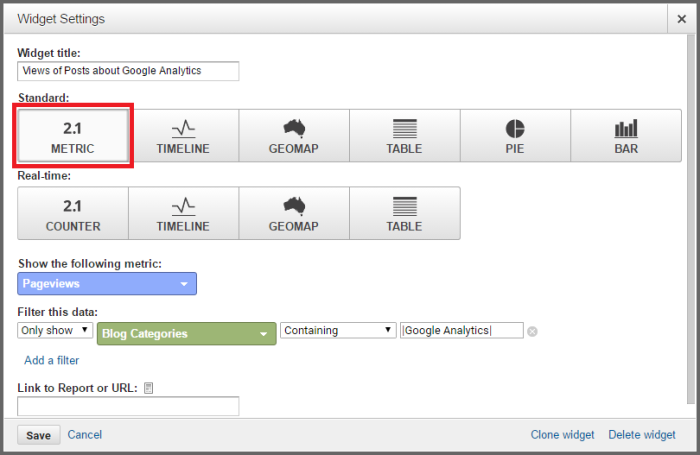
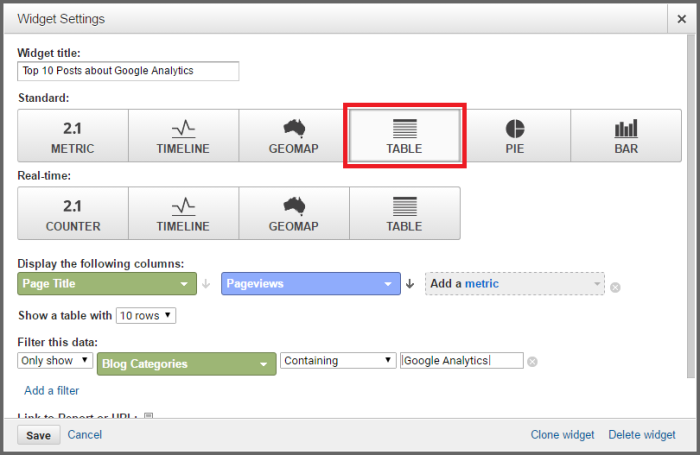
In the filter, you can also use a Regular Expression to group multiple categories into one widget, or match a word that appears in multiple categories.
Note that if you add the pageviews together from the different widgets, your result will be higher than your total pageviews from your site. Remember, this is because a blog post may fall into more than one category.
Solution #2: Google Sheets/Microsoft Excel
While the dashboard solution is great for a quick visual and an automated email, you may find that it’s necessary to see the data more clearly in a spreadsheet.
Imagine a website with recipes that are filed under different categories, and perhaps you want to pull out which course is getting the most views. It may look something like this:

Export two columns of data: One with your custom dimension and one with a metric that will sum nicely, like pageviews or total events. You need some more complicated formulas to aggregate metrics that are percentages (like bounce rate) or times (like time on page), so we don’t cover that here.
Also, be sure to avoid a common reporting pitfall and don’t try to sum session metrics – they won’t work with hit-scoped custom dimensions, like our recipe categories or blog categories.
Open your exported data in Excel or Google Drive. Here we have some simulated recipes and their categories.
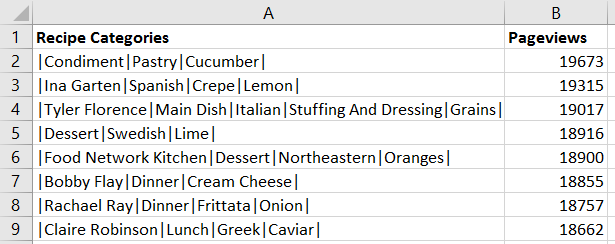
In another sheet, make a list of all of the possible categories that you want to sum up. In this case, we’ll use just the course options, like Main Dish or Dessert. (If you have way too many to do this easily, or you’re not sure all of the categories, we’ve got a solution for that down below!)
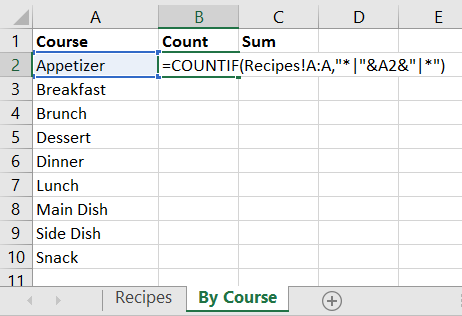
Now it’s time to do some formula magic! We’ll use two formulas – COUNTIF and SUMIF. Because we have the delimiter, we can say, "Count or Sum only the items where this exact category appears, even if it’s not the only category."
These functions will work in both Excel and Google Spreadsheets – our examples below are just Excel.
Here are the details for the COUNTIF formula:
- Range: The list that was exported from Google Analytics, (ex:
Recipes!A:A) - Criteria: Here, we can use a wildcard to specify that the term appears anywhere. The format will be Wildcard + Delimiter + Term + Delimiter + Wildcard. (ex:
"*|"&A2&"|*").
Here are the details for the SUMIF formula:
- Range: A cell reference to the list that was exported from Google Analytics, (ex:
Recipes!A:A) - Criteria: Here, we can use a wildcard to specify that the term appears anywhere. The format will be Wildcard + Delimiter + Term + Delimiter + Wildcard. (ex:
"*|"&A2&"|*"). - Sum Range: The metrics that were exported from Google Analytics, (ex:
Recipes!B:B)
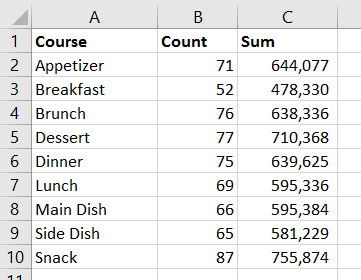
Drag those formulas down and the relative references will automatically update! And there you have it – a nice report of Pageviews by category in Excel/Drive.
Solution #3: Our Google Sheet
Let’s say you have a large number of categories. And maybe you don’t know what all the categories are, because they could change. Or maybe the formula stuff looks too complicated.
We have a Google Sheet for you!
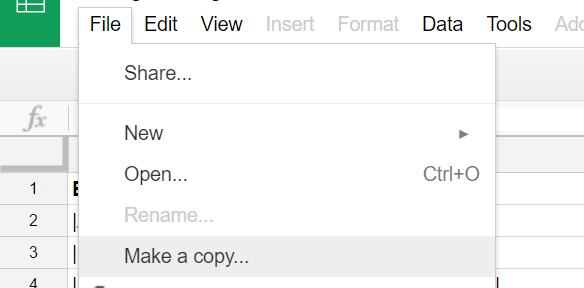
1. Make a copy of the Google Sheet.
2. Paste your two columns of data.
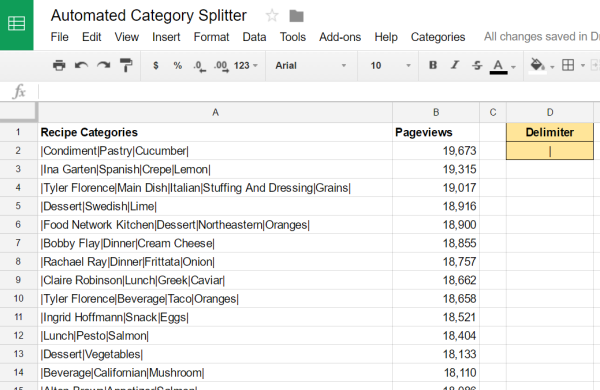
3. Enter your delimiter in the box shown.
The sheet will automatically add delimiters to the front and back of a group if it doesn’t find them.
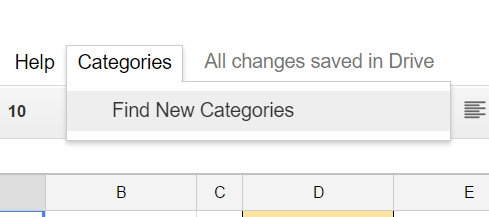
4. Choose "Find New Categories" from the Categories dropdown.
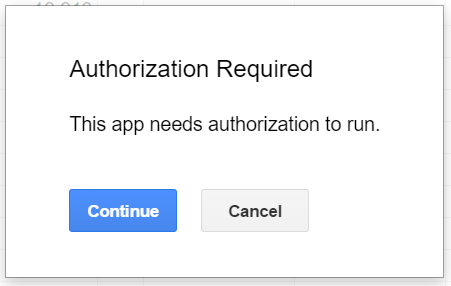
5. Authorize the Google Script to run.
Because the sheet uses a custom script, it will ask you to confirm that you want to run it.
6. Confirm and view the categories on the next tab. Voila!
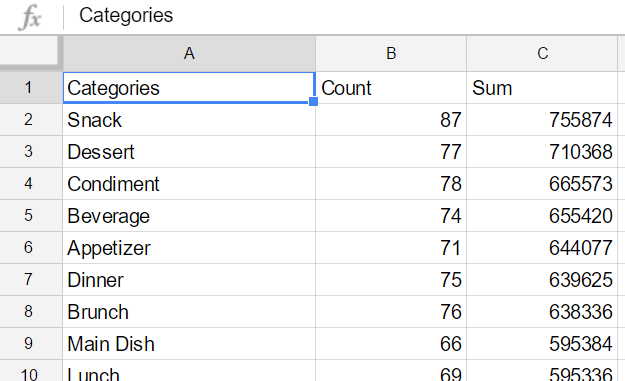
Extending the Examples to Other Use Cases
It’s easy to extend our recipe and blog examples to other use cases. When it’s an event, like a video play or form submission with checkboxes, send the custom dimension with the event hit instead of a page hit. Then simply substitute “Total Events” for “Pageviews” as the metric in your reports.
If you have a finite number of categories, under 20, then there’s another option to consider! Check out our post on using Custom Metrics to track multiple categories.
Have you faced this type of reporting scenario before? Did you come up with a different solution or find a way to report on different metrics? Does your scenario present another issue than the ones suggested here? Please share in the comments.


