The Upside Down: Negative Goals In Google Analytics
The word “goal” is all about aiming for good, positive objectives. I’m sure most of us can relate to those feelings during resolution time right now. In the world of website analytics, goals are more specifically about conversion counts, averages, and rates relating to how successful a site visit was. Those conversions represent your most valuable users and should be heavily used, or at least glanced at, in most of your web reporting. If you aren’t using goals yet, stop here and read our plea.
If you are using goals, let’s take a trip to the Upside Down…
Negative Goals

Turn smiles into frowns and set up negative goals to peak into the darker portals that may exist on your site – why are users starting to mysteriously go missing? Let the idea of a conversion become a focus on sessions where things go wrong. Instead of looking only to the positive, listen to negative measurements to prevent suspicious metrics in the background from creating larger problems, causing a poor user experience.
Why Goals?
Relying on custom reports, segments, and filters is great in most cases, but using goals (in addition) as assets for this purpose has its benefits.
In nearly all of the standard Google Analytics reports, goal metrics are included line-by-line to measure success by campaign, product, device, or almost any of the other dimensions. This makes it easy to see the portion of visits that were successful, and if the total conversions and rates are going up or down easily. The volume of actions and behavior metrics is useful in the events report and comparisons from segments are helpful as well, but a quick investigation into goals’ conversion rates throughout Google Analytics will help stop the spread of a slowly creeping fog of errors and user flow issues right away.
Quick Tip for Goal Creation
Remember to always test configurations in a test view before adding the changes to your main reporting view. Beyond a test view, you may even want to copy your reporting view for a new version with updated or additional settings (remember, you can’t delete goals so this is a good step if you have already used the limit of 20). I don’t hesitate to add views since there’s no reason not to and more backups = less risk for your data. And unlike goals, you can always delete them if you want to later on.
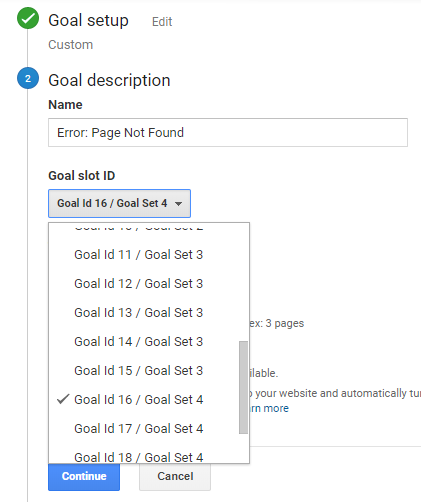
Before getting into the specific goals, one great thing you can do with them in Google Analytics is to organize goals into sets. As we start to set up our negative conversions, I would recommend grouping them into the same set.
When you begin the process of creating goals in your (personal/test/new) view, you have the option of specifying the goal set number. It doesn’t have to be sequential – for example, the first goal you create doesn’t have to be Goal ID 1/Goal Set 1. For negative goals, I like to group them into the last set (set 4).
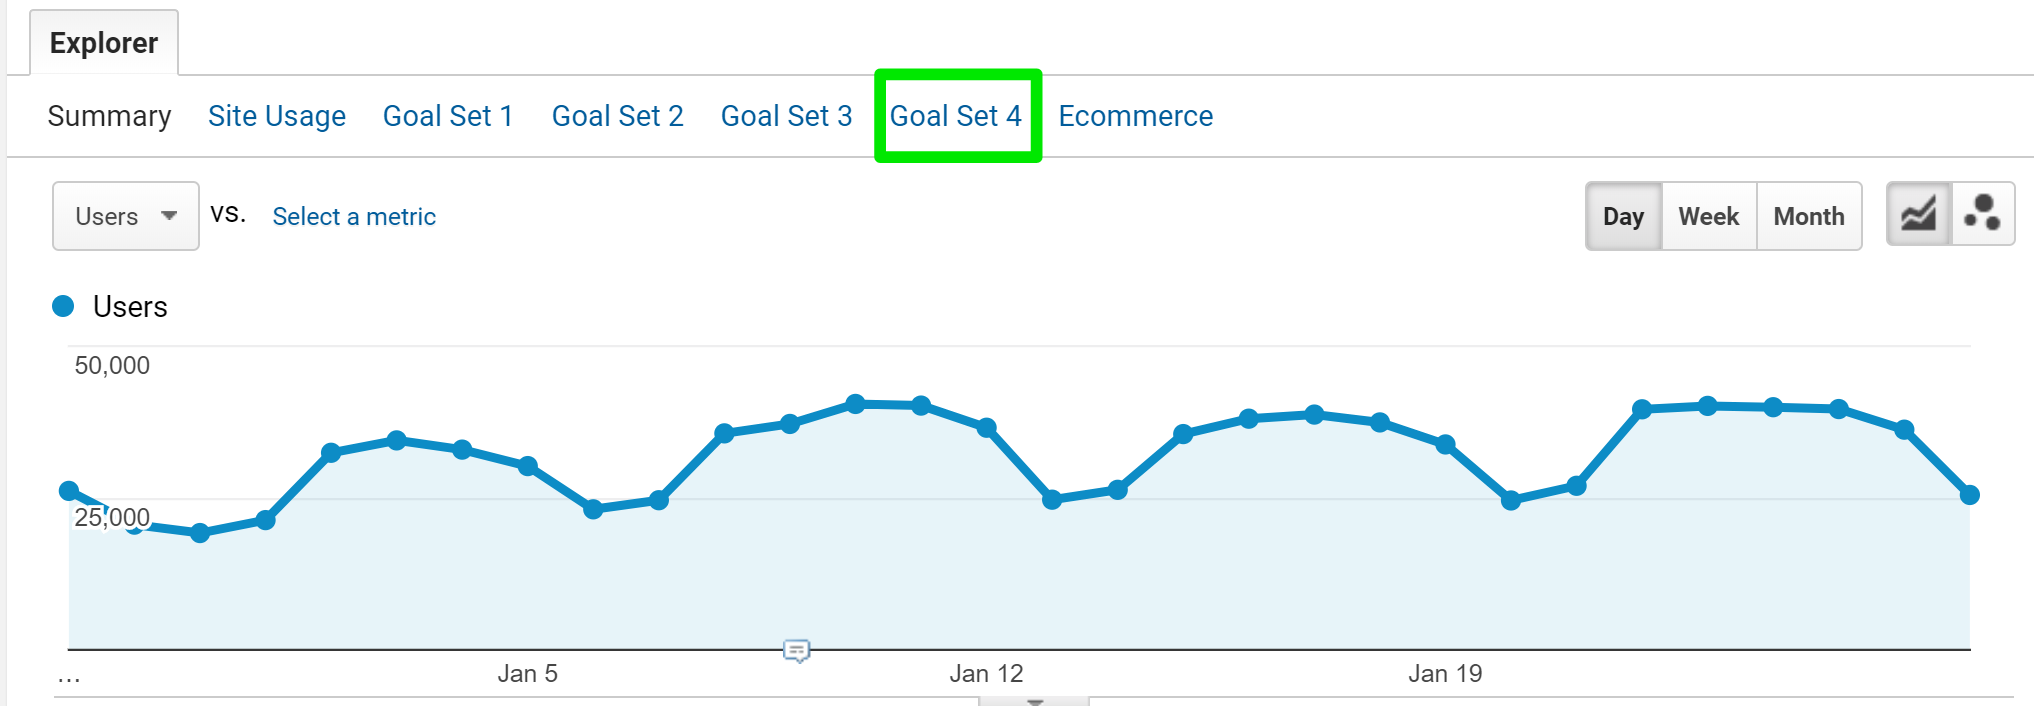
This will be great for both the goal dropdowns (on the right-hand side in standard reports), and for choosing goals as metric groups, located here:
Examples of Negative Goals
Depending on the type of site or the actions that you have available to your users, there are different actions within a visit that may signal a small flicker of gloomy activity or a full-blown monster that needs to be taken care of immediately.

404 Error Page
When users try to navigate with broken links to your site or pages within your site, they will reach a 404, or “page not found,” error. In small quantities, this doesn’t necessarily mean there’s an urgent problem on the site. It may mean that there are some lingering, old links still circulating around that do not have a redirect yet.
An example of that “full-blown monster” I mentioned is when the volume and rate of 404 errors increase at an alarming velocity. This could be a huge problem. It could be from a website redesign causing broken links in the main navigation, or erroneous redirects, just to name a couple. Even new website frameworks can cause big issues like single-page apps (Angular, as an example) that have route problems causing simple actions like refreshes to hit a 404 page.
High conversion rate? Target where these visits are coming from, the specific pages that are broken, and the previous page to where the error page occurred. We’ve talked about setting up 404 error tracking before:
Published: August 19, 2014
Contact Support Page
Do you have a software-as-a-service product? A web application, media/game site or any site that offers support to users? If so, this goal is simple and should be at the top of your goal to-do list.
Hitting a specific support page or a full user help wiki during a visit is a sign that the user could not easily find what they needed on your site or may have got confused or lost, either through content or navigation.
High conversion rate? Use the Previous Page dimension, use with the site search reports to look for trends there or check out the behavior flow report for a high-level sense of what may be happening to cause this spike.
Help Link Event
Similar to the above is a help link that may exist in the footer of your site. This can be investigated in a similar manner as the “Contact Support” page. You may have one or the other, or both. Since this is a link event goal and not a Destination goal, the standard “Page” dimension in the Behavior reports would be well-suited to look into.
Feedback Buttons
Many websites have the option for the user to answer the question, “Was this helpful?” with a “Yes” or “No” button (sometimes even a happy face or sad face). This can be at the bottom of a support page, a booking or ticketing process, detailed guides about product usage, or on refund information pages.
High conversion rate? There’s content on your site that users aren’t understanding, whether it be about how to use something, or how to solve a problem on their own. A good solution would be to change the vocabulary (too industry-specific, or business buzz-wordy speak?) and to do A/B tests on areas that are suffering more than others.
Ratings Event
Similarly, many sites that have media assets such as courses, products, webinars, ebooks, or articles, will allow users to rate the piece. Once an event is set up to record the rating choice click, a goal can be created to track low ratings. You can choose to set a goal for anything under a 5/5 or keep track of the really low ratings of anything under a 3/5 (hint: regular expressions will come in handy here).
High conversion rate? This one is easy because you can pinpoint the exact product or page that is receiving low ratings. Maybe combine it with the Content Drilldown report or Content Groupings (or custom dimensions) to investigate trends around categories or subsections.
“Review Us in the App Store” (“No”) Event
Google Analytics tracking for mobile applications has goal tracking too! Keep in mind activity on those platforms as well. For example, if your app pushes a pop-up now and again asking for a review, it might be worth tracking the “No” choice over time or the rating choice on the pop-up if it is there.
Other Ideas:
- Account deletion event
- Email unsubscribe pageview
- Refund instructions pageview
- Complaints telephone link event
- Cookie opt-out button event (no solution here, but it can be tied to lower traffic or lower, positive, conversions)
- Comment events on community help forum
- Sitemap link clicks (why couldn’t the user find the right page without using the sitemap?)
- Video buffering event
Here are some great event guides from Simo Ahava that are useful for this purpose, too:
Secret Abilities

Don’t forget about automation features in Google Analytics! Be the team member with superpowers that sees into disturbing activity automatically using custom alerts. Google Analytics allows for setting custom alerts specifically to goal conversions and conversion rates during the configuration. This will help automate the detection of an increase in negative goal conversions without having to sign in and check the reports daily or weekly.
Published: July 29, 2015
The Goal of Goals
Even though we were filled with pessimism in this post, remember that sensing negative behavior ultimately lets us fix the problem and turn back to our success metrics (and turn those frowns back into smiles). Addressing the issue when it’s small and not yet significant can let the website’s performance continue upward or get past a plateau.
In addition, these goals are the baselines that you set for yourself before taking specific actions. Consider the challenge you’d like to address: increasing helpfulness of articles, getting more reviews, decreasing 404 pages, whatever it is. These goals give you the before data that you collect for a period of time. Start making changes, either directly on the site or with a tool like Google Optimize, and use these metrics to see how you compare against your historic numbers.
Beyond goal settings, metric groups and custom alerts, these measurements can be used for other assets such as segments, custom reports, dashboards, APIs, and Data Studio. Since Google Analytics is goal- and conversion-centric, having these actions as goals gives us a lot of flexibility to do as much digging as we want.