The Importance of Cross‑Channel Media Dashboarding
In today's analytics-driven marketing world, having a dashboard to view campaign data has become commonplace. The days of manual Excel documents and cobbled-together reporting from multiple ad platforms have gone by the wayside, and interactive dashboards have taken their place.
The ability to populate real-time data and easily build visualizations is powerful, but having this capability does not necessarily make your marketing campaign better than it was before. The true power of marketing dashboards lies in the ability to look at data across channels to get a full picture of customer performance, giving marketers the ability to optimize and double-down on campaign elements that contribute to success.
Why Is Cross-Channel Paid Media Dashboarding So Important?
The distinction between a single-channel dashboard and a cross-channel dashboard is an important one to understand. While the names may be self-explanatory, the advantages of using a cross-channel dashboard are often lost on marketers and lead to cumbersome reporting tools that don't make those marketer's lives any easier.
Media platforms such as paid search engines, social media marketplaces, and programmatic DSPs will often set advertisers up with a dashboard that provides data for their channel alone. This is called a single-channel dashboard, which can be serviceable when trying to establish performance trends within that single channel. However, as digital marketers, it's important to constantly evaluate all media channels we invest money in. Furthermore, it's important to evaluate how these channels work in tandem with each other.
For example, how does an increase in channel A affect channel B? Similarly, if channel A stops performing well, where should we shift our budget? How are we pacing to spend across all paid media channels by the end of this week? This month? This year?
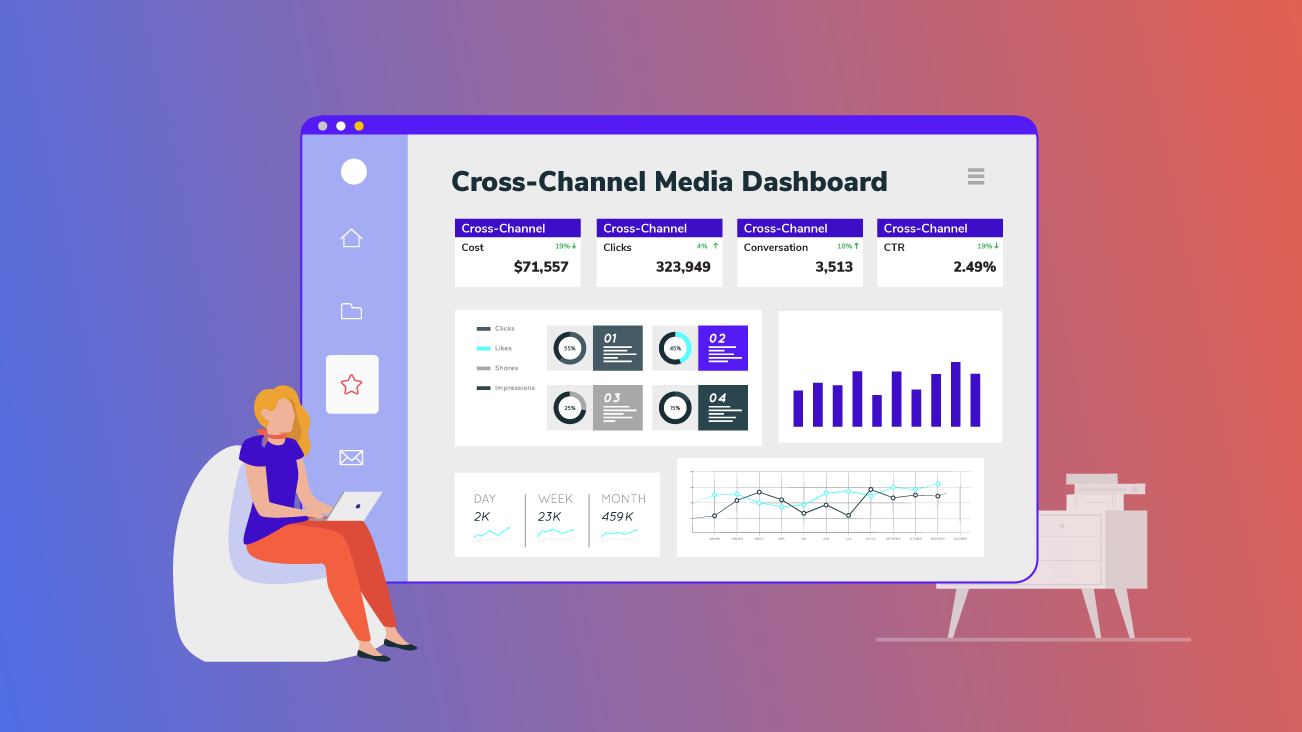
These are questions that marketers face daily, and the answers don't lie in a single channel dashboard or even a collection of single-channel dashboards. The most efficient way to answer these essential questions is to build a cross-channel marketing dashboard that connects to data from multiple paid media sources and aggregates it automatically so all channels can be compared side-by-side on a wide variety of metrics.

What Does a Cross-Channel Dashboard Allow Me to Do?
The primary advantage of a cross-channel dashboard is that it promotes efficiency through optimization. Media optimization should be a constant, iterative process that is essential in any marketing campaign. To constantly generate insight, there needs to be a way to easily view all campaign data in one place.
Highlighting the performance of all channels side-by-side is the most efficient way to find the optimizations that will help drive your campaign closer to achieving its goals. Focusing less time on pulling and aggregating data from multiple reports or multiple single-channel dashboards allows marketers to focus on generating key insights that will help bring the campaign closer to achieving its goals.
In the current global pandemic, media optimization has become even more important due to some clients working with restricted budgets or sudden shifts in their budgets. The ability to assess performance quickly and become more nimble in optimization is especially important for these clients, and can make a huge difference in their organization's annual goals.
Cross-channel dashboards also allow for increased transparency across marketing teams. Digital marketing is often separated into siloed teams out of necessity, with the search team solely looking at paid search data, the social team solely focused on paid social data, etc. With a cross-channel dashboard, marketers across an entire organization have more confidence and peace of mind that their campaign is achieving its goals not only on an individual channel level but as a whole.
"But My Ad Agency Already Sent Me a Dashboard!"
When building new media dashboards for clients, we often hear that dashboarding (even cross-channel dashboarding) was attempted in the past but either wasn't found valuable by the client team or didn't provide all metrics needed to make business decisions.
For example, knowing how many impressions and conversions were generated in a campaign is useful, but these metrics only tell a portion of the story and don't provide enough data to draw meaningful conclusions that can drive strategy.
In order to provide enough metrics and dimensions to build data-driven optimizations, data throughout the conversion funnel must be taken into consideration. Ad impressions, ad clicks, ad spend, spend pacing, site visits, button clicks, clicks to call, likes, shares, video views, conversions, revenue, and more will all paint the full picture of media performance that only impressions and clicks cannot.
Oftentimes, many of the metrics above are not available due to API restrictions or technical limitations. However, with the right tools, all of this data can be automatically extracted from media platforms and site analytics platforms into a singular data source which can then be used to build a dashboard that marketing teams will want to use daily.

Connecting Data Throughout the Customer Journey
The key to any great reporting dashboard lies in how the data is ingested and blended. The use of an ETL tool provides a distinct advantage when ingesting and blending data for cross-channel media dashboarding. ETL stands for "extract, transform, and load," and is a technology that performs those three functions repeatedly to build an aggregate dataset from multiple sources.
Using API connections, data is extracted from media platforms, transformed into a uniform format, and loaded into a data storage platform (such as Google Big Query, Snowflake, or SQL) that can be used to connect to data visualization software like Google Data Studio, Tableau, Looker, or PowerBI.
These data extracts are then automatically run daily to pull fresh data and load it into the data storage platform. Using this technology, Facebook, LinkedIn, Google Search, Bing Search, Display & Video 360, YouTube, Salesforce, Google Analytics, and any other source of customer data can be extracted and combined to gain a full understanding of user behavior.
Another advantage of automated data extraction is that it takes the human element of aggregating and cleaning data out of the picture. Not only does this reduce the possibility of error, but allows marketers and analysts to focus their effort on finding the insights that will achieve campaign goals instead of pulling data extracts manually or stitching together multiple datasets offline.
Single Source of Truth to Analyze Performance
While the specific metrics that a campaign should be focusing on vary based on client needs, the one constant is a need for a holistic approach to media analysis and optimization. Whether your campaign consists of two media channels or twenty media channels, your campaign will never be fully optimized until you can give marketers a single source of truth to analyze performance.
The best solution to generate this source of truth that minimizes effort, the possibility of error, and can maximize your team's time for insight generation is a cross-channel dashboard. If any of the struggles and challenges I mentioned above sound familiar to you, stop juggling a handful of manual, single-channel reports and focus on building a cross-channel dashboarding solution to help drive your campaigns forward.
News & Insights
Related Perspectives