A Practical Guide to GA4 Anomaly Detection
Every analytics team has been there. A sudden traffic spike appears in the dashboard, conversions drop overnight, or engagement surges without explanation. The first question is always the same whether this is real, or something is broken?
The difference between teams that answer that question in minutes and teams that spend days chasing false leads often comes down to one capability, anomaly detection. In Google Analytics 4 (GA4), its effectiveness depends on the underlying data foundation and operational processes supporting it. Building both requires a deliberate approach.
Start with Your Data Model
GA4 is fundamentally event-driven. Every interaction including page views, scrolls, conversions, and clicks is captured as an event with associated parameters. These fall into four categories:
- Automatically collected events (e.g., page_view and session_start)
- Enhanced measurement events (e.g., scrolls, outbound clicks and video engagement)
- Recommended events
- Custom events defined through implementation (e.g., via Google Tag Manager or Firebase)
If those events are inconsistently named, incompletely tracked, or poorly structured, anomaly detection becomes unreliable before it ever starts. GA4 can’t identify what falls outside of “normal” if its picture of normal is distorted. Clean, well-governed data isn’t a prerequisite for anomaly detection, it is anomaly detection.
What GA4 Flags, and What It Misses
GA4 uses machine learning to establish expected ranges for your metrics based on historical patterns. When a metric falls outside that expected range, it surfaces as an anomaly. Not all of those flags represent real problems.
Common sources of false positives include launching new event tracking (which creates spikes in interaction data without any corresponding change in user behavior), site or app updates that add or remove features, new consent management policies that affect total event volume, and maintenance windows that create temporary data gaps. Teams that understand how GA4 processes sessions and attribution are less likely to waste time investigating anomalies that are actually side effects of the platform itself.
Context is what separates a useful anomaly flag from noise.
Step 1: Spotting Anomalies in GA4 Explorations
GA4 Insight Alerts notify you when something goes wrong. Explorations are where investigations happen. GA4’s Explore section gives analysts a flexible workspace to investigate anomalies after they surface.
Within a free-form exploration, teams can enable anomaly detection directly on a line chart:
- In GA4, click Explore in the left navigation panel
- Create a new Free-form exploration or open an existing one
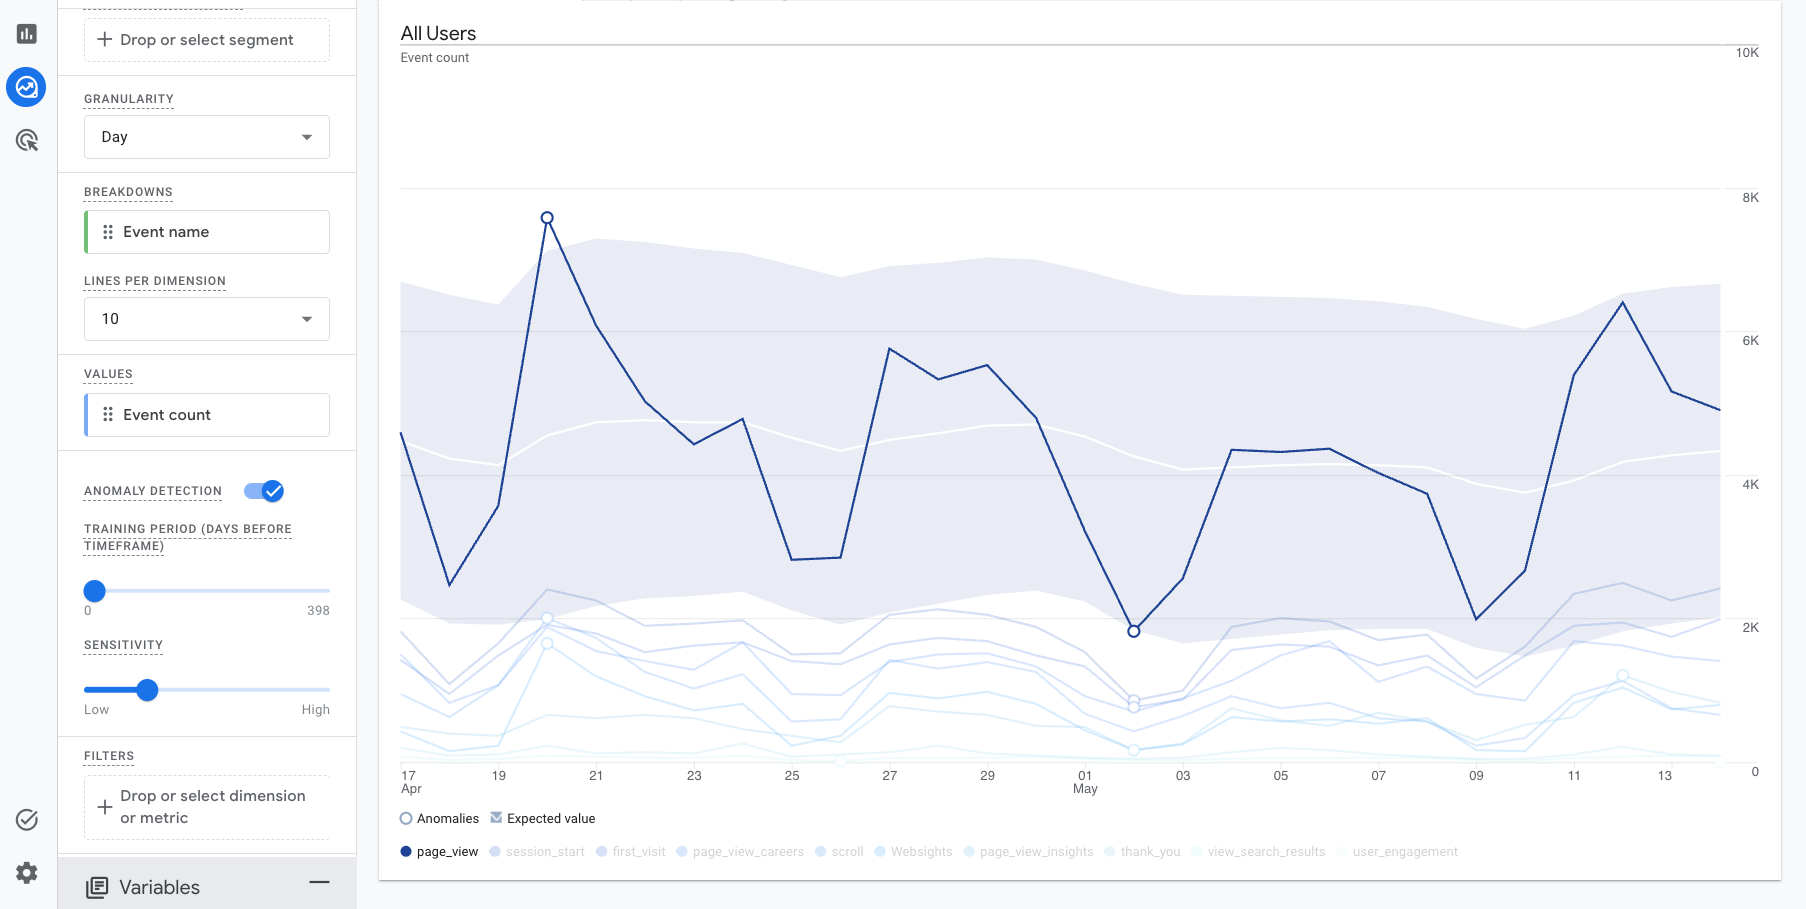
- Add a dimension and metric to monitor. The screenshot below uses Event Name and Event Count, but there are many different dimensions and metrics (e.g., Sessions, Conversions, Engagement Rate)
- In the Settings panel on the left, switch the visualization type to Line chart
- Once the line chart renders, scroll to the bottom of the “Settings” column to turn on Anomaly Detection
- GA4 will overlay the expected range as a shaded band on the chart, with anomalous data points highlighted for easy identification.
Sensitivity can be adjusted (low, medium, high) depending on how broadly or narrowly the team wants to define “unexpected.”
Step 2: Add Context with GA4 Annotations
Annotations are one of the most overlooked tools in anomaly analysis. They allow teams to document important events directly alongside their data, including campaign launches, site releases or redesigns, tracking changes, and outages or incidents. Without annotations, every anomaly becomes a guessing game. The same data, with annotations, becomes explainable.
Note: Over time, native annotation support in GA4 has evolved, and availability may vary depending on property type (standard vs. GA4 360). Check your team’s current property settings to confirm annotation functionality.
Best practice: Create a habit of logging changes the moment they happen, not after anomalies appear. This turns your analytics workspace into a living source of truth.
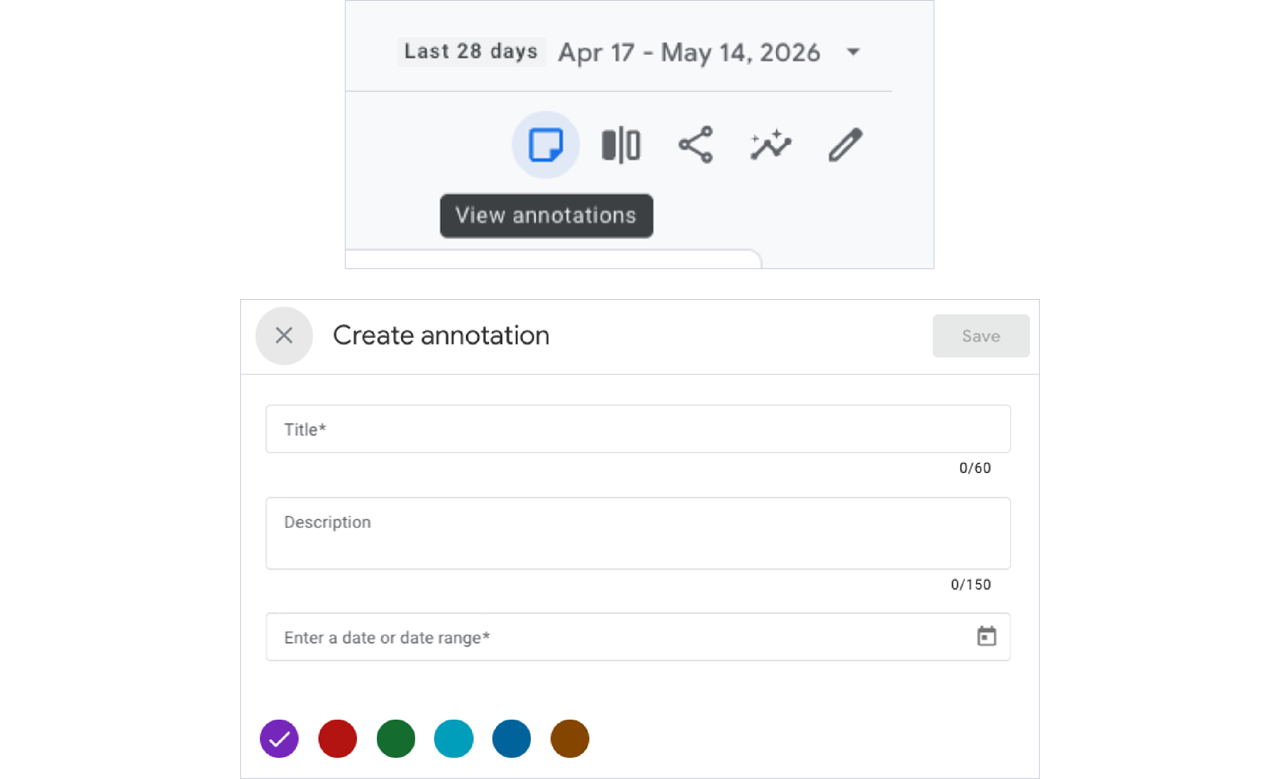
Annotations can be added from any default report by clicking on the sticky note in the top right corner of the screen or by navigating to Admin –> Data Display –> Annotations. From either place, users can add a title, notes, dates, and a color to stay organized. Anyone who looks at a GA4 report with a date range that includes an annotation date will be able to see the sticky note with comments.
For teams that want to make this process more consistent, this related guide walks through a lightweight workflow for automating GA4 annotations with Google Sheets and Google Cloud Functions.
Step 3: Move from Detection to Alerting
Spotting anomalies in reports is helpful, but it isn’t scalable.
High-performing teams move toward proactive alerting, where anomalies trigger notifications in real time. This means issues are caught early, teams respond faster, and revenue-impacting problems don't go unnoticed.
GA4 Insight Alerts Are a Useful Starting Point
GA4’s built-in Insight Alerts are a practical starting point. Teams can configure alerts based on metric thresholds or statistically unusual changes, with email notifications sent on a daily, weekly, or monthly schedule.
- In GA4, click Home in the left navigation panel
- Scroll to the bottom of the Home page until you see “Insights and Recommendations.” Click “View all insights”
- In the top right corner, click Create to start a new custom insight
- Choose condition type, either Anomaly detection (where GA4 flags statistically unusual changes automatically) or Threshold (where teams define a specific value to trigger the alert)
- Select the metric to monitor (e.g., Sessions, Conversions, Revenue, or Bounce Rate)
- Apply any filters to scope the alert, for example, limiting it to a specific traffic source, country, or device category
- Set your Evaluation frequency, to daily, weekly, or monthly depending on how quickly teams need to be notified
- Add email recipients who should receive the alert notification
- Give the insight a clear name (e.g., “Weekly Conversion Drop — Paid Traffic”) and click Create
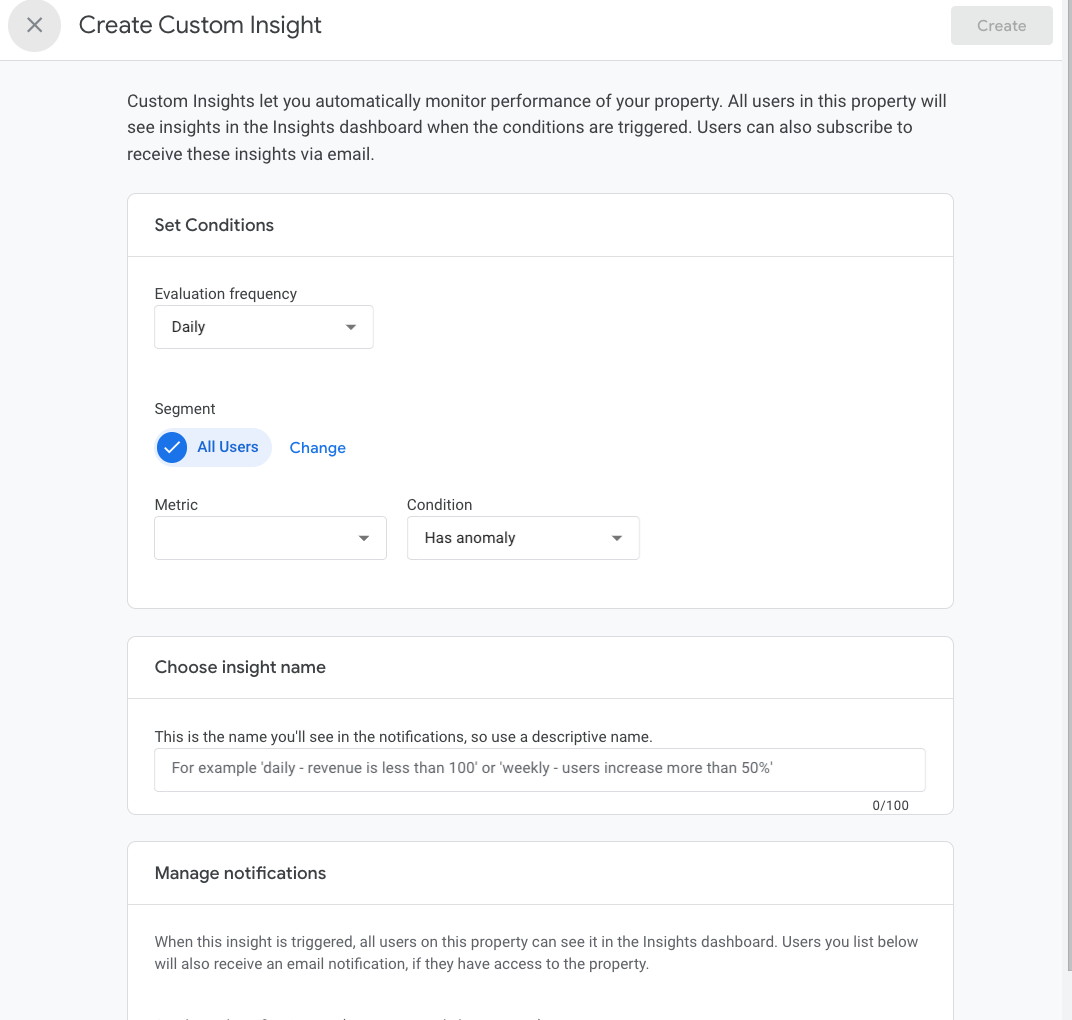
Once created, GA4 will automatically evaluate the condition for the chosen schedule, and email recipients will be notified if the threshold or anomaly criteria are met.
Get More Value from Insight Alerts
Create separate alerts for the most business-critical metrics, not one broad rule. For metrics that vary seasonally, use Anomaly detection mode and, for hard floors such as a minimum daily revenue threshold, use Threshold mode. Pair alerts with annotations so that when a notification fires, the team can quickly cross-reference what changed in the property.
The limitations become apparent at scale; alert customization is relatively basic, volume is capped, and there is no native integration with external workflows or communication tools like Slack. For teams without a cloud data infrastructure, Insight Alerts are a practical first step before moving to a custom BigQuery-based solution.
Using Explorations to Investigate an Alert
When an Insight Alert fires, Explorations are the natural next step for root cause analysis. A few useful approaches are listed below.
Segment by traffic source
Create a free-form exploration with Sessions broken down by Session source / medium to see if the anomaly is isolated to one channel (e.g., a paid campaign spike or an organic drop).
Use the Funnel exploration
If a conversion anomaly is flagged, build a funnel to identify at which step users are dropping off or converting at an unexpected rate.
Compare date ranges
Use the date range comparison feature to overlay the anomalous period against the previous period or the same period last year, making it easier to distinguish a true anomaly from a seasonal pattern.
Apply user segments
Isolate the anomaly by device type, geography, or new vs. returning users to narrow the affected audience.
Pro tip: Save the most-used anomaly investigation explorations as templates in your team’s GA4 property. When an alert fires, your team can jump straight to the right view without rebuilding the report from scratch.
Step 4: Scaling Up with Google Cloud
The GA4 interface is ideal for percent increases or decreases for a specific metric or Audience. The “anomaly detection” alert in GA4 also doesn't let users define the threshold for what should be an anomaly. Custom solutions fill that gap. To operationalize anomaly detection at scale, many organizations extend GA4 using Google Cloud.
A typical architecture looks like this:
- Export GA4 data to BigQuery
- Build anomaly detection models using statistical or machine learning approaches
- Define thresholds and business logic
- Trigger alerts via Cloud Functions or Workflows
- Send notifications via email, Slack, or other channels
This approach enables custom anomaly definitions beyond GA4 defaults, cross-channel and cross-platform analysis, real-time or near-real-time alerting, and integration with internal systems. For example, users can define anomalies, such as a conversion rate drop beyond 15% compared to baseline (illustrative threshold, adjust based on your business context), paid traffic increases without corresponding revenue, and sudden shifts in landing page behavior. When those conditions are met, automated alerts are sent instantly.
Common Pitfalls to Avoid
Even with the right tools, anomaly detection can fail if the fundamentals aren’t in place. Watch out for:
Inconsistent Event Tracking
If an event name or parameter changes frequently, the baseline becomes unstable.
Lack of Documentation
Without annotations, anomalies lack context and slow down decision-making.
Over-Reliance on Defaults
GA4’s built-in insights are useful but limited. Customization is key for real business impact.
Misinterpreting Data Behavior
Not all anomalies are errors. Some are expected outcomes of how GA4 processes sessions and attribution.
The Capability Beyond the Feature
Anomaly detection is a capability built from clean data, consistent documentation, well-configured alerts, and, when the business requires it, a cloud infrastructure that can match the complexity of what teams actually need to monitor.
When those pieces are in place, analytics stops being a passive reporting function and becomes an active monitoring system. The goal is to know when something happens, and fast enough to do something about it.
News & Insights
Featured Perspectives