Segment Your Goal Funnel In Google Analytics
What is a Funnel?
Your goal funnel is the set of required pages leading up to your final goal, such as a purchase. You may be familiar with the Funnel Visualization report in Google Analytics (GA). It shows you how many visitors go to each step and how many leave the funnel at that step. You can spot trouble points with your funnel and take steps to correct the issue. Here’s what the report looks like:
The Problem:
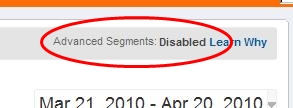
While you can segment goal metrics such as goal completions, starts and values in GA, you can’t segment the Funnel Visualization report. You can’t see how different types of visitors may leave the funnel at different steps. For example, you may just want to see where new visitors abandon your goal funnel, compared to returning visitors. When you look up at Advanced Segments in the top right of the Funnel Visualization report, here’s what you see:
The Horizontal, Segmentable Funnel
I want to show you a method that will allow you to see your goal conversion funnels in any report, segmented however you want. I’m going to name it the “Horizontal Funnel” since we’ll be viewing it left to right, instead of top to bottom.
Let’s start with what you’ll get, using this method.
The traditional GA Goal Funnel report shows
- Number of visits to each step in the funnel
- The percentage of visits that continued to the next step
- Where exiting visits went.
With the Horizontal Funnel method you’ll see
- Number of visits to each step in the funnel.
- The percentage of visits that did not continue to the next step
You don’t get to see where exiting visitors went. . .but you WILL be able to:
- Apply Advanced Segments
- See the funnel for multiple segments in the same report
Let’s look at an example of what a traditional e-commerce funnel that looks like:
Shopping Cart –> Address Info –> Payment Info –> Review Order –> Thank You
In the image below, the values outlined in blue are the visits to each step, and the values outlined in orange are the exit rate between steps.

That’s the “what”. Now for the “how”.
1. Create the Goals
For each step in the funnel, we create a separate goal in GA. This provides the values in blue: how many visits touched each step. Now we want to be able to get the values in orange, the exit rate between steps. In each of the goals following the first step in the conversion process, we create a funnel. Each funnel contains a single step which is the Goal URL for the preceding goal. That’s the key. The preceding goal becomes the Funnel Step 1 URL for the next goal.

2. Create the custom report
Now that the goals are set up we can create the custom report we need to view the data. To set up the report we are going to use two different metrics, Goal Completions and Abandonment Rate.
The Goal Completion metric is the number of visits in which a particular Goal URL was visited at least once.
The Abandonment Rate metric is the percentage of visits that started the funnel (saw Step 1), but did not complete the goal.
In our Goal #17, we made the Funnel Step 1 = Goal #16 Completion. So, Goal #17 Abandonment Rate = percentage of visits that saw Goal#16 but did not complete Goal #17 = Exit Rate between the 2 goals. In this example the first step in the funnel is in Goal Slot #16, so Goal 16 Completions goes first. The second step was in Goal Slot #17, so we place Goal 17 Abandonment Ratenext, followed by Goal 17 Completions.
Then Goal 18 Abandonment Rate, followed by Goal 18 Completions.
And so on.

After you have all the goals in place in the Metrics section of the report, it’s time to move on to the Dimensions. In this case, we chose to dimension by Keyword. But you may wish to see your goal funnel report by City, State, Browser, Landing Page, or whatever is most appropriate for your situation.
That’s it. Happy Funnel Segmentation.
Small Update:
As Ophir Prusak helpfully pointed out in the comments section, it would be a good idea to note that the values you get using this method may be a little different from what the Funnel Visualization report shows.
One of the reasons for this is that the Funnel Visualization report makes the assumption that If a visit includes Step 3, for example, then it MUST include Step 2 and Step 1.
So if an actual visit sees Step 3, But DOESN’T see Step 2 or Step 1 — what does GA do? It adds a count to Step 1 and Step 2 ANYWAY.
This Horizontal Funnel method does not do this. So if you have a funnel with entrances into the middle of the funnel, numbers may be different.
There are probably other good reasons why they could be different as well, but that is the most obvious one and definitely needed to be pointed out.
For more about tricky funnel issues in GA try checking out this post on our blog: Funnel Problems in Google Analytics
-John
News & Insights
Related Perspectives


