The 30,000 Foot View And Success Metrics

One of the most challenging aspects of being a consultant is being able to convey your progress to your clients (and occasionally, boss) in an easily-digestible, understandable manner. This usually involves paring down reports to their barest essentials — stripping away the extraneous in order to reach a core of actual insightful data. It involves keeping everyone focused on overall trends instead of micro-analyzing on a weekly or even daily basis. After all, most website changes, especially SEO-related changes take time to really come to fruition.
The idea is to avoid the possibility of the client freaking out when traffic drops 30% after a bout of 301 redirects to new search engine friendly URLs. The rankings (and traffic) will come back in a few weeks if everything is allowed to shake down adequately, but it won’t work if the process is reversed due to yanking out the new urls and going back to the status quo because the party in charge was obsession over daily or weekly traffic levels instead of looking at the bigger, overall picture.
In this post, I’ll talk about data presentation and the most important success metrics (as I see them) for SEO. The examples I’ll use are real, albeit sanitized for client confidentiality.
SEO Success Metrics
Usually, when a client comes to us, they’re utterly obsessed with rankings. They have a shortlist of about 3 or 4 keywords or phrases, usually highly competitive head terms, and those terms are all they care about. They are preconditioned to judge the efficacy of SEO efforts by this one metric. It takes a long time to wean them of their dependably on keyword rank tracking.
It’s not that rankings are not important. Far from it. In order to achieve the REAL goal, rankings have to be achieved and upheld. But the 30,000 foot view model of reporting doesn’t jive with multiple reports and goals. In order to distill insight from the data puke that is GA reports, it’s important to pick one, or at most two metrics for success to report on. So lets cut out the middle man (rankings) and focus on what really matters to clients — even if they don’t know it: Traffic and Conversions.
The overall goal of optimizing ones site for the search engines is to get higher quantities of good quality, converting traffic from the organic search engine results page. Once you understand that, figuring out how to set up your reporting is easy. You look at traffic, you look at organic traffic, and you look at conversions and you focus on trends.
Google Analytics Data Presentation vs. Excel
Google Analytics is pretty awesome. To those of us who use it every day, it is intuitive, well organized and offers some pretty awesome ways to slice and dice data. It’s really easy to forget that our clients, who in many cases are not as tech-savvy or comfortable with browser based programs as we are can be overwhelmed by the choices and actually dislike the visualizations that we find so incredibly useful.
I’ve been delivering monthly reports to clients for years in every format you can think of. I’ve created reports on the GA dashboard, exported them into pdfs, ccvs, excel sheets… you name it, I’ve done it. All in an effort to find the best way to show them what they NEED to know without distracting them by what they don’t really want to know. The report that I have the most success with is actually the simplest excel report imaginable. It’s a month to month comparison of overall traffic, un-paid search engine traffic, unbranded search engine traffic and the quantity of goal completions due to search engine traffic. These are the resulting charts I send out monthly:
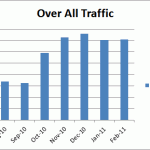
This graph represents all traffic from all channels on the website. I include it to give clients context for the organic traffic and also because it’s something they invariably want to and should see. It’s important, however to make it clear that this graph does not represent SEO efforts specifically, rather overall performance.
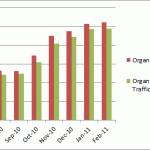
This graph represents organic traffic and unbranded traffic. The importance of organic traffic as a metric for success is pretty obvious. However, I think that the true measure of success for SEO is unbranded organic traffic. After all, a site that’s not ranking for its own brand name, with some notable exceptions, has some pretty big problems. I find it hard to take credit for branded traffic.
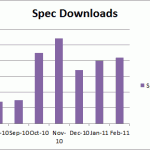
This last graph is an example of goal completion broken out by month over time. The spec download was this client’s most important goal. Using GA annotations, it’s easy for me to explain the sudden jump: we created a landing page for the download and optimized it for the appropriate keywords. I don’t have to include the ranking performance of the specific keywords for this report because the results are obvious.
Date Ranges
You’ll notice that I’m using entire months instead of, say, 30 day chunks of time starting on the same day of the week. Does this skew the data slightly? Yes. However, since it’s my goal to focus on traffic and conversion trends rather than specifics, I find this acceptable. There are cases when the difference in traffic from weekdays to weekends is so drastic that I’ll change this methodology, but those cases are rare.
The 30,000 foot view is a great way to spot trouble areas and places where success is really evident (always a great thing to point out to clients and your boss.)
News & Insights
Related Perspectives


