More To Love In Google Analytics Flow Visualization
The Google Analytics product team continues to roll out improvements in the new v5 interface, and the Flow Visualization reports are no exception. Significant enhancements announced recently include the addition of non-URL goals like Visit Duration to the Goal Flow report, a brand new Events Flow report, and the ability to compare date ranges across the entire family of Flow Visualization reports.
Compare Date Ranges in Any Flow Report
“Compare to Past” is a longstanding feature of the date range selector in Google Analytics, but prior to this update was not available in Flow Visualization reports. Now you can see the percentage increase or decrease (color-coded green and red) at each node along the flow.
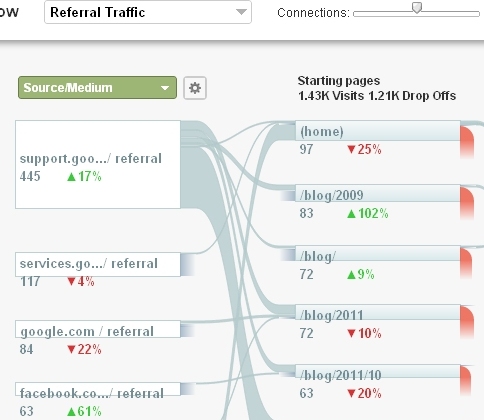
The image above shows a date comparison for the Visitors Flow (found in the Audience reports). I changed the default dimension “Country/Territory” to “Source/Medium” by selecting from the dropdown menu, and then applied the segment “Referral Traffic” by selecting from the dropdown menu above that.
You can see that referrals from support.google.com and from facebook.com are up, while referrals from services.google.com and google.com are down. The comparison continues across starting pages and next pages. The numbers in gray indicate data for the most recent date range, while the percentages indicate the change from the earlier date range.
Explore the New Events Flow Report
If you’re tracking both pageviews and events on your site, you may have noticed that the Visitors Flow covers only pages viewed and not events like downloads or video views or clicks on outbound links. You may be especially interested in the path that leads to certain important events.
The Events Flow report presents visitor flow across events in the same way that the Visitors Flow report presents their flow across pages. Note that only events are included here; pages without events are not part of the Events Flow visualization.
The image below shows the flow of events that includes outbound links and social actions (tweets and likes captured with _trackEvent), but you can imagine many other types of event flows such as a series of game actions (start, level-up, claim-prize), a series of shopping actions (compare-items, wish-list, add-to-cart), or a series of actions involved in a college application process (contact, download, submit-form).
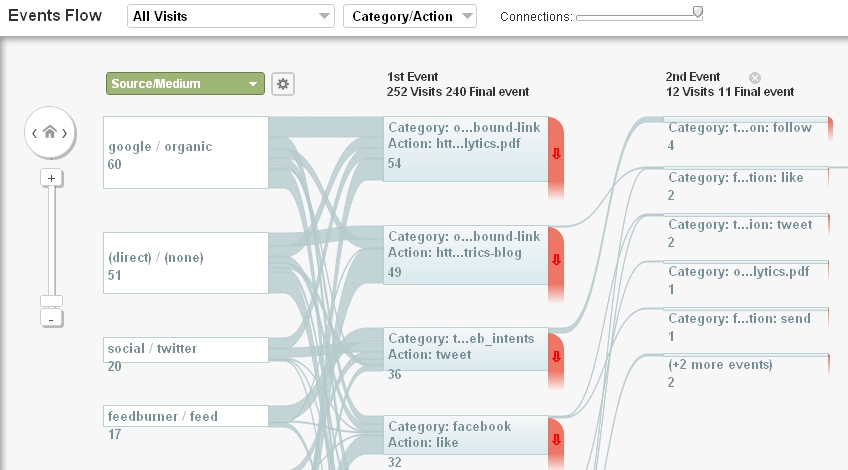
Here I’ve chosen to view nodes by “Category/Action” instead of a more rolled-up view where each node would represent “Category” alone. I can see that when the first event is a tweet, 4 times out of 36 the next event is a follow.

What’s more interesting to me in Events Flow (just as in Visitors Flow), are the options I get when I click on a node: “Highlight” or “Explore traffic through here.” These allow me to focus on a particular event. When I choose “Explore” I can see events before and after a node, and I can add more steps to the left or right.
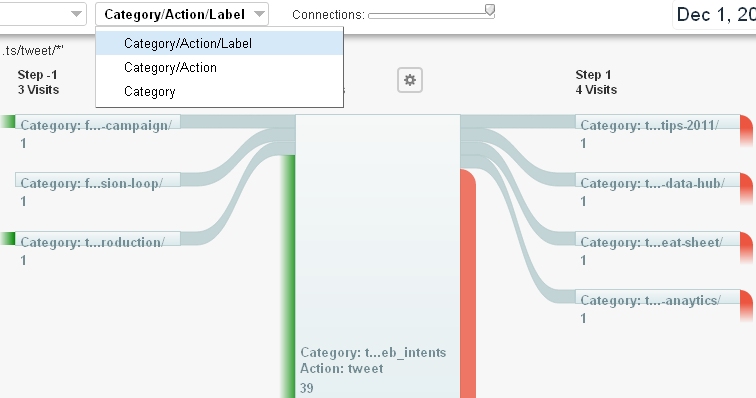
And I can get more granular by choosing “Category/Action/Label” as shown above. In this case, my event labels contain the blog pages that were liked or tweeted. In the interface, the nodes expand as you mouse over them so you can read the entire label.
View Non-URL Goals in Goal Flow
While the most obvious benefit of the Goal Flow report is its visualization of steps in your funnels, you can also glean useful data for goals that have only one step. And now those one step goals can include engagement goals like Visit Duration (formerly Time on Site). So I can ask, for example, what sources resulted in visits more than 5 minutes long?
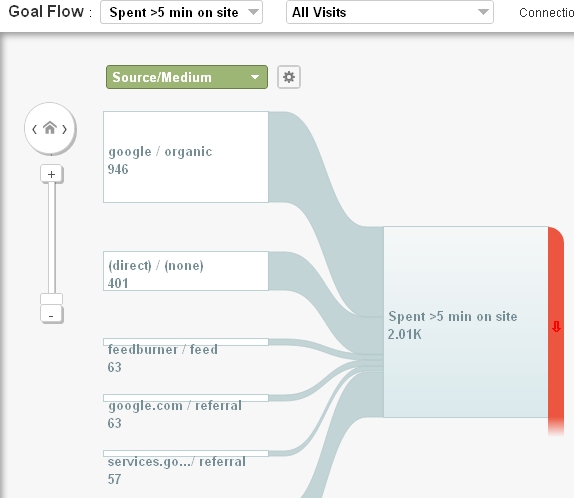
The image above shows the dimension “Source/Medium” and which segments of that dimension contributed to longer visits. I can segment the Goal Flow just like the Visitors Flow and Events Flow, using a default or custom segment.
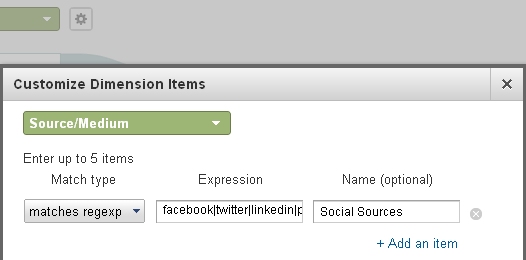
And don’t forget the option to customize the dimension, by clicking the gear icon next to “Source/Medium”… you can quickly find a single source that may not appear in the top nodes, or even define an ad hoc set of sources, without creating a custom segment.
View “Event Funnels” in Events Flow
You can’t put events in funnel steps, so Goal Flow can only show you which visit segments led to a single step Event Goal. But if you have a process that’s easily defined by a series of events, you could use Events Flow to see whether enough visitors flow through those events to make a funnel-like path.
And the best part is you can segment Events Flow using the full range of default and custom segments. Look at the flow across events for just New Visitors, or for Visits with Transactions, or even segment by Custom Variables for visits from different visitor types. Sounds like a great topic for a future blog post!
What’s your reaction to this latest round of enhancements to Flow Visualization? What’s still on your wish list? Let me know in the comments.
