TOOL: Facebook Post Optimizer
Lately I’ve been on a bit of a tear against sites and tools that pretent to telling you the optimal time for posting content to your social networks. There’s a lot of things they do that I question, and I cover that in depth in this article here on Marketing Pilgrim.
This post is to share a tool I’ve developed using a Google Docs’ spreadsheet that lets you simply copy & paste your Facebook Insights data into it and instantly see when you’re optimal posting time is for both organic reach (not paid) and engagement (story) generation. Better yet, both of these figures are normalized to your current follower count. This means that the data from two weeks ago, before you added 200 followers in that campaign you ran, is just as valid as the data from today – they’re both based on the number of followers at the time of posting.
How does it work?
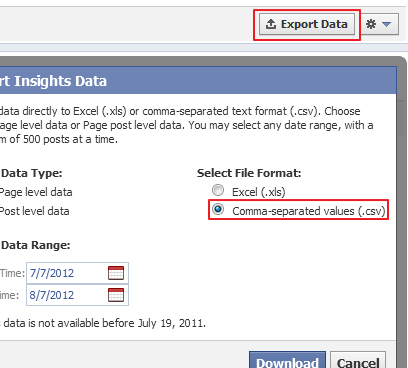
Step 1: Download your Insights Data
Download your Page-level and Post-level data in .CSV format from Facebook’s Insights Manager. Download your page level data one day earlier than your post level data. This ensures that the sheet can find corresponding likes for each post you’ve made.

Step 2: Enter your dataset into the tool
Copy and paste these spreadsheets into the respective PostData and PageData sheets in the spreadsheet. Because of the 50,000 character copy and paste limit of Google Doc’s, only copy and paste up to column ‘H’ of the Page-level data set.

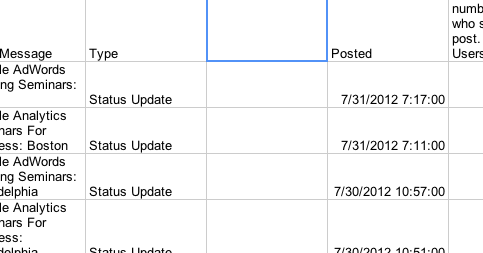
If you haven’t targeted a specific country for one of your posts during this time, you’ll need to add an extra column to your Page-level data sheet. Just add an extra column in between column C, ‘Type’ and column D, ‘Posted’. You have to do this before you paste it into the spreadsheet, otherwise it might get finicky. Pages who have posted a country-specific post will already have this column, labelled ‘Countries’, and won’t have to do anything.

Step 3: Check your Insights
Check out the Reach or Stories sheet. You should see graphs for each day of the week from 0-24 hours with your posts graphed at their respective times. This will give you a top-level overview of when your posts are doing well. You can cross reference particular points to find deeper insights.

Other Notes
Careful with you data
I would warn against using data from before July 3rd, 2012. That’s when Facebook announced it would now be including mobile reach in it’s reach. It also announced a change in the fundamental way that it calculated reach. This means that all of your previous data won’t include mobile views and could poison your insights. I did a write-up on this, coincidentally also for Marketing Pilgrim, that you can check out here.
Time zone considerations
It’s calibrated to spit you that data in EST, because Facebook’s downloadable spreadsheets are in PST by default. Working on a different time? Just replace .125 in the ‘D’ column of the ‘Magic’ sheet (it’s at the end of the formula) with .0416 for each hour plus or minus EST that you’re working in.

Woo! Just post at all the same times and you’ll get more reach/engagement!
Not quite. This is only a jumping off point. For starters, the data only shows your effectiveness based on when you’ve already published. If you do well at 3:00 PM on Wednesdays doesn’t mean you might not do EQUALLY well at 10:00 PM. It’s only as smart as the data you feed into it, so make sure you’re testing some different posting strategies if you haven’t already.
Correlation is not causation. Look at your results, make some educated hypotheses, and test, baby, test. This is meant to be a starting point, not an end-all.
Also don’t forget that Facebook uses it’s EdgeRank algorithm to determine who sees what. Although the Ticker can provide you a powerful place for real-time feedback and interaction, most consumption happens in the feed. This tool will help you optimize for the Time Decay portion of the algorithm, but there’s still Weight and Affinity scores that affect your reach.
Want to test it out yourself? Awesome. Go ahead and make yourself a copy here.
Having an issue? Write me in the comments section or tweet @LunaMetrics and I’ll help you get it sorted.


