Unmasking (Not Provided) Goal Completions In Google Analytics
As of late, the SEO blogosphere has been rich with posts from authors seeking to diagnose seeming declines in branded organic traffic. The common culprit (or deceiver, if you will) is Google’s grand obfuscation – (not provided). In the technology industry, the presence of (not provided) in keyword reports has proliferated drastically. In September, LunaMetrics saw nearly 65% of our organic search keyword data veiled in uncertainty. That’s right; more data is hidden than is available. Are you comfortable extrapolating from 35% of organic search visits? Probably not.

Comfort is a commodity, after all – a commodity granted to those who haven’t seen such a stark increase in (not provided). The more actual keyword data you have access to, the more likely it is that your extrapolation across the (not provided) segment represents an approximate reality. While there have been a number of viable proposed methodologies for recovering lost keyword data, it remains clear that, at a granular level, the long tail segment has been the most victimized. Keywords that might’ve once shown up once or twice in the monthly report might now remain absent (or hidden, rather). This makes extrapolating individual keyword volumes from the long tail segment grossly misrepresentative.
Reporting on (Not Provided)
In looking at overall goal conversions from organic search traffic, we might be tempted to postulate that the conversion keywords that show up in our reports are distributed similarly across the (not provided) segment. However, if you’re dealing with a lot of long tail terms, this will likely be a hapless assumption. With big time converters, this kind of extrapolation is okay. As was mentioned above, though, it doesn’t work as well when you’re dealing with what could be occasional occurrences. You can use data from past months to triangulate assumptions, of course, but even this can be misleading.
As SEOs and analysts, we love granularity. It’s great to be able to see which keywords brought visitors who eventually converted. On the other hand, we need to present our clients with progress. As the percentage of (not provided) continues to increase, it becomes more and more disadvantageous to completely exclude the segment from our reporting.
Gains in organic search traffic will appear lessened, and losses will be accentuated. Established brands that practice SEO proactively will likely observe non-branded search traffic grow more rapidly than branded search traffic. As the (not provided) segment becomes larger, the relatively stagnant (or slightly growing) branded segment appears to decrease. The growing non-branded segment is also partially obfuscated, but unlike with the branded segment, increases may still be observed. This is because non-branded growth (due to the brand’s SEO/marketing efforts) is sufficient enough to make up for the increase in (not provided). This is one plausible explanation for the “decrease in branded” that many have observed recently. In fact, the missing branded traffic has likely been claimed by the (not provided) segment. Misleading, right?
Segmenting (Not Provided) Conversions
As these segments become more and more clouded, so too do our reports on goal conversions resulting from each of them. The SEO department is concerned primarily with increasing non-branded organic search traffic, but we also care about conversions from that traffic. If the new traffic we’re driving to clients’ websites doesn’t result in some conversions, we aren’t doing a whole lot of good, are we? Given that the traffic is converting, though, it is essential that we convey these returns in our reports.
Our primary goal is to provide figures for goal conversions from branded and non-branded organic search. This is high-level, of course, but it purveys a nice indication of month-to-month progress. Remember, this process is by no means exacting; however, it’s certainly better than ignoring the (not provided) segment and its resulting conversions. Let’s get going.
The underlying assumption here is that you’re using Google Analytics for tracking.
—
1. Create Custom Reports for branded, non-branded, & (not provided) Goal Completions.
You might already have these. If you don’t, no problem. Take fifteen minutes or so and get ’em set up. If you’re not sure how to go about doing this, now is a great opportunity to learn! We went ahead and set up the (not provided) Custom Report for you. Go ahead and check it out.
You can create the branded segment Custom Report by copying the provided (not provided) report and editing the keyword filter to include only branded keywords. A simple way to do this is to use the pipe (|) character to separate branded terms.

The non-branded report is similar. Simply copy your newly created branded Custom Report and edit the keyword filter to exclude all branded keywords and (not provided). Again, this can be accomplished with a Regular Expression using the pipe (|).

2. Add corresponding metric widgets to your Google Analytics dashboard.
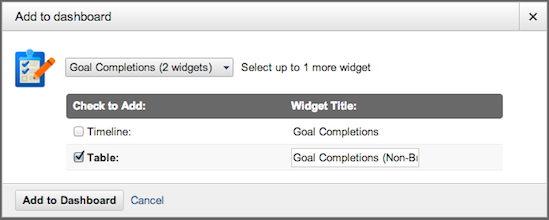
Next, you’ll want to make things a tad easier by creating widgets for each Custom Report you’ve designed. We could have relied on widgets alone, but it’s nice to have an associated Custom Report so that you can set up email reports, exports, and whatnot. Okay, so, to create a widget for a Custom Report, simply navigate to the ‘Add to Dashboard’ option beneath the report title. Clicking this should open a modal similar to the one shown below.

You’ll want to select the dashboard to which you’re looking to add the widget (I elected to create a new dashboard for Goal Completions.) and choose the table option. You can click in the Widget Title column to edit the title of your new widget. Once you’ve done so, click ‘Add to Dashboard.’
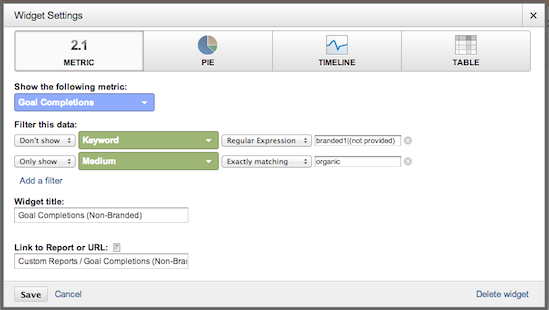
When you’ve added all of your new Custom Reports to the dashboard, you’ll notice that the tables display total Goal Completions for individual keywords, but not the entire segments (save (not provided) – as this is the only “keyword” in the segment). This is great information, but it’s not what we’re interested in capturing. To get segment totals, you’ll want to go into each widget’s settings and choose the ‘Metric’ display at top. You’ll have to reapply the Goal Completion metric and Keyword/Medium filters; just copy and paste your branded Regular Expression from the Custom Reports. Here’s a look at the non-branded segment’s widget settings.

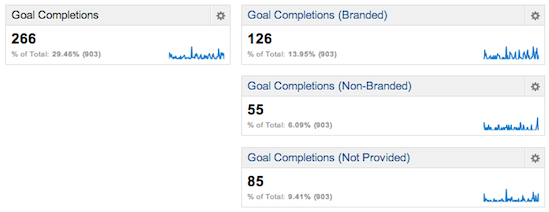
Once you’ve converted all of your existing widgets, you’ll want to add one last Metric widget – Goal Completions. For this, you’ll need to include only one filter: Only show Medium Exactly matching organic. The finished dashboard should look something like this:

Notice how the segment totals (in the right column) sum up to the Goal Completions total (at left). This consistency is what you’re looking to achieve.
3. Use provided data and (not provided) segment to estimate totals.
Okay, this is the part where we make our missing branded and non-branded goal completions reappear. If you, too, have imagined a personified Google waving his or her magic wand shouting “Disapparate!” (and keyword data melting into oblivion), this is for you. Brace yourself. We’re going to do a little math magic. I recommend automating this process in an Excel or Google spreadsheet, but that’s for another time. For now, we’ll just look at the general formula. We’ll use the monthly numbers displayed in the dashboard above to provide example along the way. Remember, this is all with regards to organic search traffic.
—
Provided Goal Completions = Total Goal Completions – (Not Provided) Goal Completions = 266 – 85 = 181
Branded Percentage = Branded Goal Completions / Provided Goal Completions = 126 / 181 = 0.70
Non-Branded Percentage = Non-Branded Goal Completions / Provided Goal Completions = 55 / 181 = 0.30
Branded Portion of (Not Provided) = (Not Provided) Goal Completions * Branded Percentage = 85 * 0.70 = 60
Non-Branded Portion of (Not Provided) = (Not Provided) Goal Completions – Branded Portion of (Not Provided) = 85 – 60 = 25
Total Branded Goal Completions = Branded Goal Completions + Branded Portion of (Not Provided) = 126 + 60 = 186
Total Non-Branded Goal Completions = Non-Branded Goal Completions + Non-Branded Portion of (Not Provided) = 55 + 25 = 80
And now, we come full circle:
Total Goal Completions = Total Branded Goal Completions + Total Non-Branded Goal Completions = 186 + 80 = 266
—
Now, I realize that we could have accomplished this more efficiently (we only need three of the four data points used – though non-branded and branded are musts). However, taking everything into consideration (at first, at least) helps with comprehension. While our new totals are still estimations, they certainly provide a better indication as to how many Goal Completions are coming from branded and non-branded keywords. This is great for clients, as well as us! I’d say that 80 non-branded Goal Completions is preferable to 55. Wouldn’t you?
—
This is just one more post dedicated to fighting the good fight against (not provided). If you have any further insights, feel free to share in the comments below.


