Google Analytics Filters: Don't You Forget About Me

Why do advanced segments get all the love in Google Analytics? What about report filters and profile (view) filters? Filters and segments work differently. Do you know when you need a filter instead of a segment?
You may think a segment is isolating the data you want and instead, it returns too much data. Or you may think you’re getting all the data you want, and later find out a big chunk is missing.
To understand when you need a filter, it helps to know how filters and segments work. I highly recommend a read, or re-read, of Avinash Kaushik’s explanation of hits vs. sessions, because it all comes down to segments working on the session-level, and filters working on the hit-level.
But first let me show you how segments can go wrong.
Segments=Session-level, Filters=Hit-level
When you ask Google Analytics to give you some data for an advanced segment, GA hears you say: “Show me all the visits in which condition X (and/or other conditions) happened.” What you get is data for those conditions and everything else that happened in those visits.
On the other hand, filters are a way of asking for individual pieces of information, or just part of a visit. GA filters let you sift through the data and get only the pieces you want.
Segments are sub-optimal in two scenarios.
Scenario #1: More data than you wanted
Let’s say you want to see data for only one page or a subset of pages. Or for only one category of events. So you make an advanced segment A: “Include Page, contains /movies”. Or advanced segment B: “Include Event Category, exactly matches watch-movie”.
There’s a good chance a problem will be immediately obvious when you look at your Content report with segment A or your Events report with segment B. “Hey, what are all these other pages (or events) doing in here? GA is broken!” It won’t be obvious if you create and apply one of these segments in a traffic report or audience report.
Remember, asking GA for segment B (event category=watch-movie) is like asking for all the visits where a visitor watched a movie. You could get events like download-movie-poster, views of pages with no video player, etc. as long as the visitor also watched a movie at some point during her visit.
Solution: In-line report filter, basic
If you want data only for the watch-movie event, simply go to the Top Events report and use the in-line report filter. Type watch-movie into the filter box and press enter. To get data only for /movies pages, go to the All Pages report and type /movies into the filter box.

You may have noticed that I only mentioned two reports, Top Events and All Pages. What if you want to see other data like what countries those movie-watchers are from, or what traffic sources send the most visitors to your /movies pages?
Solution: In-line report filter plus a secondary dimension
You can stay in the All Pages report, keep your /movies filter, and add Source as a secondary dimension. This adds a second column to the report, so you have /movies pages in the first column under Page, and Sources like google or facebook.com under Source.

This increases the number of rows in your report, because each page may be associated with many sources. You may only care about a few of these sources. Let’s say you want to see all the /movies pages viewed by people who came from Facebook.
Solution: In-line report filter, advanced
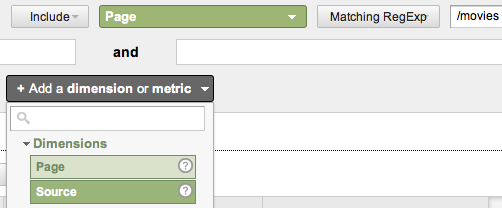
To use the advanced filter, click “advanced” next to the filter box. The characters you already typed into the filter are there, plus the option to add another dimension or metric.

Click “add a dimension” and choose Source from the list. Then type facebook into the empty box next to Source, and click “apply”. You’ll probably see both facebook.com and m.facebook.com in the Source column. Edit the advanced filter so it says m.facebook if you want to see only visitors from the mobile version of Facebook. Or use a regular expression to look for several sources at once, e.g. facebook|youtube|pinterest = visitors from Facebook or YouTube or Pinterest.
Bonus Tip: All of the above, plus a new primary dimension
One more way to wring the maximum information out of a standard report with filters is to drill into the row you want and then change the primary dimension.
For example, suppose you want to see all of the cities in India where your movie-watchers are. You can go to the Top Events report and type watch-movie into the filter, and you can add City as a secondary dimension, but you can’t add Country as a third dimension.
When the item you want to filter is present in just one row, drill into that row by clicking on it, e.g. click on “watch-movie”. Then change the primary dimension at the top of the table by clicking “other” and selecting City in the list. (You can just start typing City instead of scrolling through all the options to find it.)

Now add the secondary dimension of Country and use the advanced filter to include only India. Click the X to remove the City from the advanced filter, to keep all cities from India in the report.
Scroll to the top of the report and read the breadcrumbs to see exactly where you are and what the data represents. If you started by drilling into watch-movie in the Top Events report, then below the report title the breadcrumbs will say, “All >> Event Category >> watch-movie”. You can even click the arrow next to the last breadcrumb to drill into a different row without going back and starting over.
Pretty cool, eh? You can drill into the All Pages report (or any other report) like this, too.
Scenario #2: Less data than you wanted
Another scenario where you want to turn to filters instead of segments: when sampling threatens to doom your data. You see the dreaded yellow bar in your reports.

Earlier this summer my colleague Sayf Sharif mentioned using filters in his blog post on how to deal with sampling in GA.
Sometimes the sampling occurs when you apply a segment but you don’t really need one, because the data is already available in standard reports. Any standard report that you can filter to get what you want will not be sampled, because GA has already “pre-aggregated” the data for that report. The filter lets you sift through what is already there.
Unfortunately, this does not apply to situations where you want to add a secondary dimension or change the primary dimension. When you ask for a combination of dimensions and metrics that is not pre-aggregated, GA computes the new table for you on request. These requests may be subject to sampling, especially if your site gets a lot of traffic.
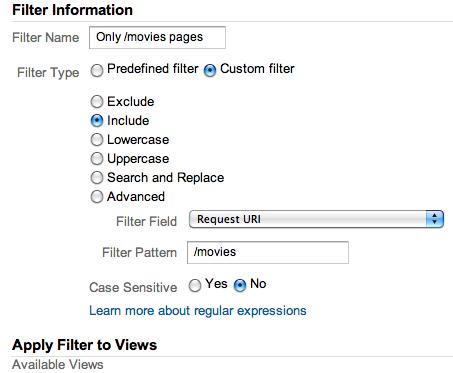
Solution: Profile (view) filter
The solution requires setting up another view of your data, using a different type of filter. You have to be an administrator because applying filters at this level is a way of changing the dataset permanently. It also only affects the data from the time the filters are applied, so you can’t go back and look at historical data this way.
You’ll create a new profile (view) and apply a new filter or filters to that view only.
For example, you may want to see all the data just for visits to your /movies pages, without having to deal with sampled data that may occur when you choose a secondary dimension. Or you may want to see content or event data for certain traffic sources that you are particularly interested in, such as social sources. Or maybe movie-watching is such an important event on your site that you want to see data only for that event.

Once you’ve created the new view of your data, you’ll have to wait a day or two before you have anything to analyze. You’ll still get sampling if you apply a segment or secondary dimension, but you won’t need to do that as often. The standard reports will be unsampled and will already be limited to just /movies pages or just social sources or just watch-movie events, however, you set them up.
Now instead of adding Source as a secondary dimension, you can simply start in the traffic reports and see all the sources that sent visitors to the /movies section of your site. Use the in-line report filter to see specific sources and you won’t get sampling because GA is sifting through the data that’s pre-aggregated in the standard report.
To see movie-watchers from cities in India, go directly to the Location report and drill into India to see all the cities. Because it’s a standard report in your new profile, it is totally unsampled.
Do you rely more on segments or on filters when you analyze GA data? Have you discovered an unexpected benefit of using GA filters or a clever way to configure them? Please share in the comments.


