Getting Started With AdWords Location Based Bid Adjustments
If any of you are like me, you hear/read about a great idea but then you’re often left with the question – “But where do I start?” For me, it was the simple matter of using AdWords location-based bid adjustments. The theory is awesome: You set a positive or negative percentage on a city, state, or country that will tell AdWords to raise or lower your Max CPC bid on a keyword by that percent. So for example, if you wanted to raise your keyword bids 15% in New York City, you indicate it in the Campaign Location Settings by adding a 15% next to NYC. If you want to lower your keyword bids in Washington DC by 20% you indicate it by adding a -20% as the location adjustment. All of this sounds grand. But how do you actually discover a good percentage point to start with per city/state/country? Well I’ll get there, but first you need to discover what areas you are performing well in.
Discover Where Your Geo Strengths Lie
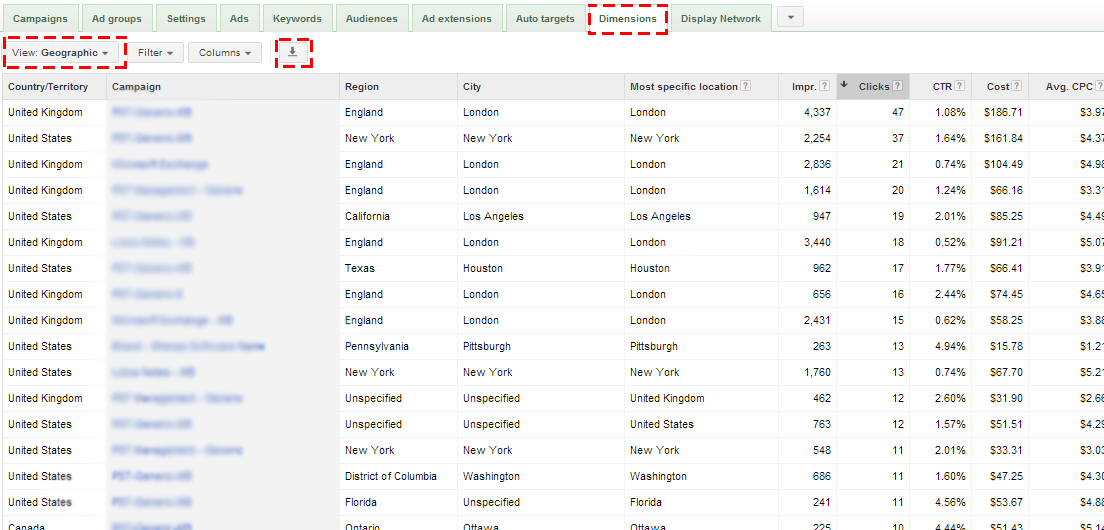
Navigate to the Dimensions Tab in Google AdWords and then click View >> Geographic. You’ll want to make sure that the Columns are set to show:
- Campaign
- Country/Territory (If you were combining domestic and international targets)
- Region
- City
- Most specific location
- Impressions
- Clicks
- CTR
- Cost
- CPC
- Conversions
- Conversion Rate
- Cost/Conversion
If you’d like, you can also add the Competitive Metrics, but for the purposes of this post, I don’t. You can also test out how you use Metro Area and Most specific location, but I like keeping it straightforward by just using Region and City.
Select a date range that would sufficiently cover a solid length of time that your campaigns were running. I’m a big fan of the 90-day time range for something like this, but am also fine working with 60 or 30-day ranges.
Then click Download and open in Excel.
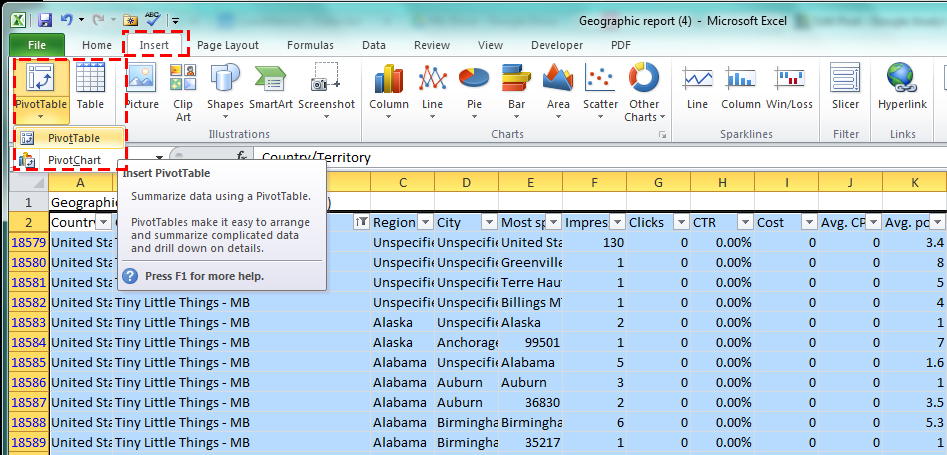
After you open it in Excel, select all your data and insert it into a Pivot Table.
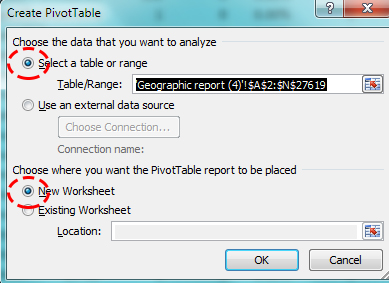
At this point, you’ll be taken to the blank pivot table where you can begin analyzing your geo data. First, you should set up the Pivot Table for success by applying some number formats and creating some calculated fields. For today, let’s start with Calculated CTR and Calculated CPC.
Select the Pivot Table, then click “Options” in the top of the screen. Click “Calculate Field”.
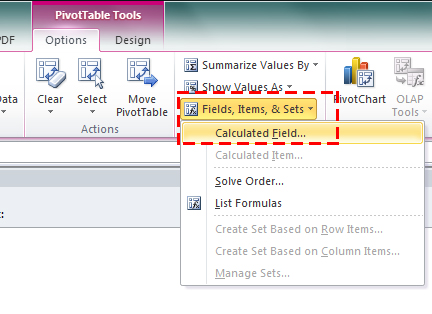
After that, name the new field “Calculated CTR” and create the formula = Clicks/Impressions. It will drop a new column in your Pivot Chart that you need to adjust. Select the new Column, then click “Field Setting”.
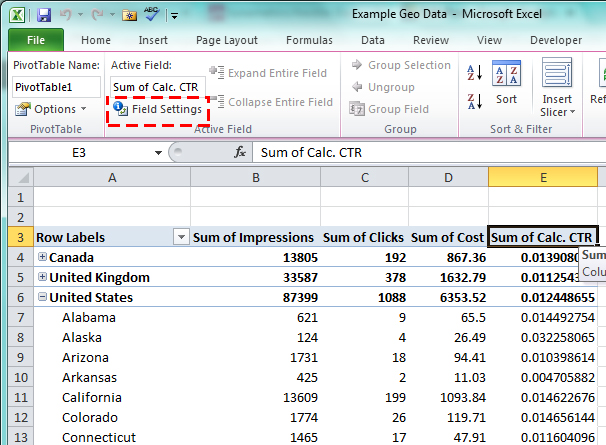
The click “Number Format” and choose percentage, 2 decimal places.
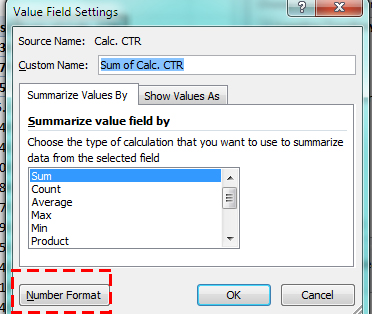
After that, do the same steps for Avg. CPC, but change the equation to Cost/Clicks and make sure the Number Format is Currency. You can also add a Calc. Cost/Conversion column using the equation Cost/Conversions and set the Number Format to Currency.
While I often look at the overall performance, I do like to hone in on geo-data per campaign. That means I need to add Campaign in the Report Filter. Here is what your Pivot Chart should look like now:
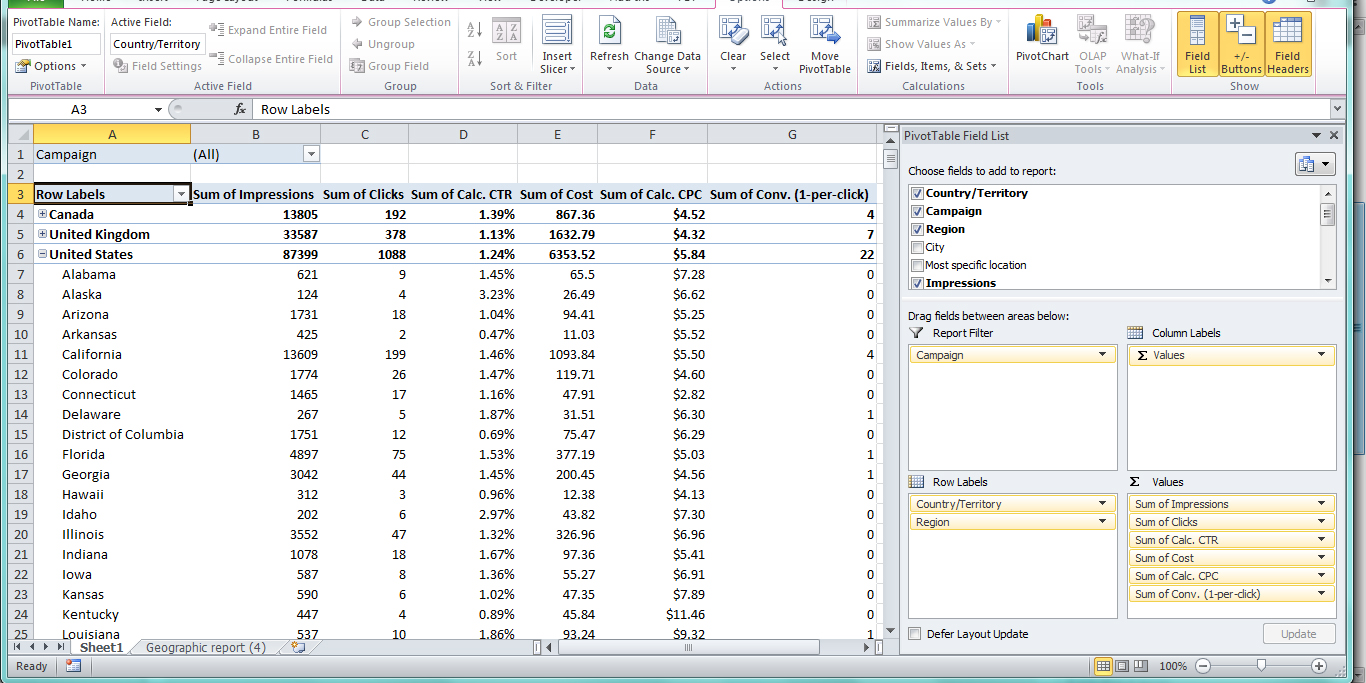
From this point, you can make some determinations by campaign. Here are a few high-level things to look for:
What areas/states (overall and per campaign) had the highest Cost/Conversion?
What areas/states (overall and per campaign) had the lowest Cost/Conversion?
What areas/states (overall and per campaign) had the best CTR?
What areas/states (overall and per campaign) had the worst CTR?
But really, what we are looking for are some experimental location bids. So here’s how I do that. For the purposes of this example, I’ll only look at the United States data. First, copy and paste that Pivot table data into another tab. Note: Only past the values, then reapply the number formatting.
Then sum the Impressions, Clicks, Cost, and Conversions. I then just make my calculation for CTR, CPC and Cost/Conversion in the total lines.
After that, I add columns called “% Cost/Conv. Better” and “% CPC Higher”. You can really customize from there. For the client whose data I used in this example, I kept it to simply answer the question, “What state had a Cost per Conversion better than Average?”
In the new columns, you are basically finding out by what percent the value is better or higher than the average column total. So to find out how much better Tennessee’s Cost/Conv. is than the average, follow this equation. Remember that the Total line contains the Average Cost/Conv. and to use it in the first part of the equation as the hold.
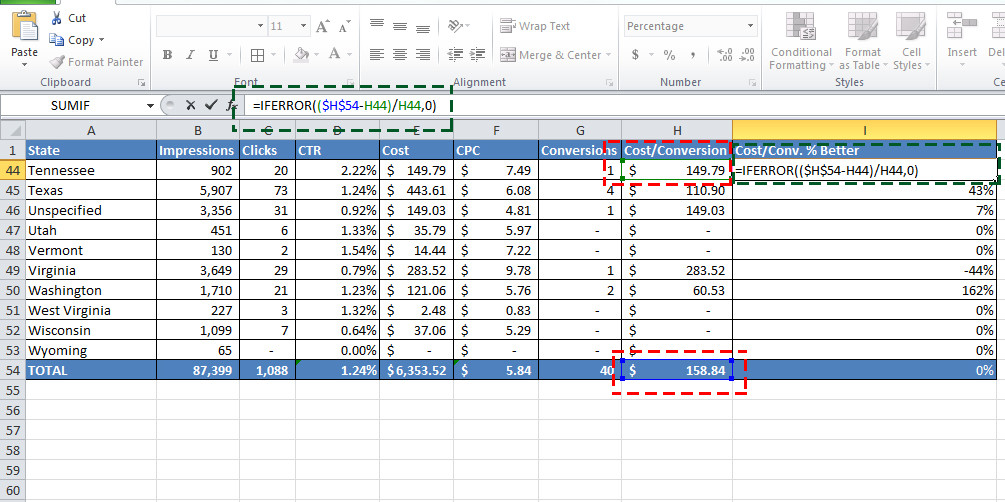
Make sure you add $ in the first part of the cell equation so that you can easily drag the equation down the rows. I also make sure to apply the Number Format to %.
Calculate the Bid Adjustment per Location
After that, add another column called “% Bid Adjustment”. I like to play conservative and use the Excel equation to Round to the the nearest whole 0.
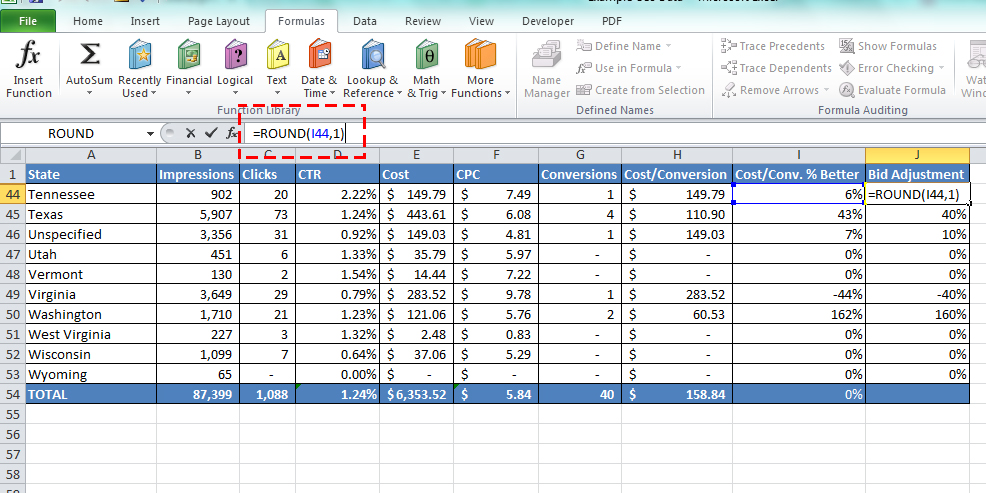
And there you have it! Some initial location bid adjustments to start with. Simply add them into your campaigns using Editor or right from the User Interface. If there are some states that seem really egregiously bad converters, then consider making them Negative placements. You may not be applying a bid adjustment to every area and that’s fine, too.
How to Apply the Bid Adjustments
Here’s where you add it in the AdWords Editor, after clicking into a campaign:
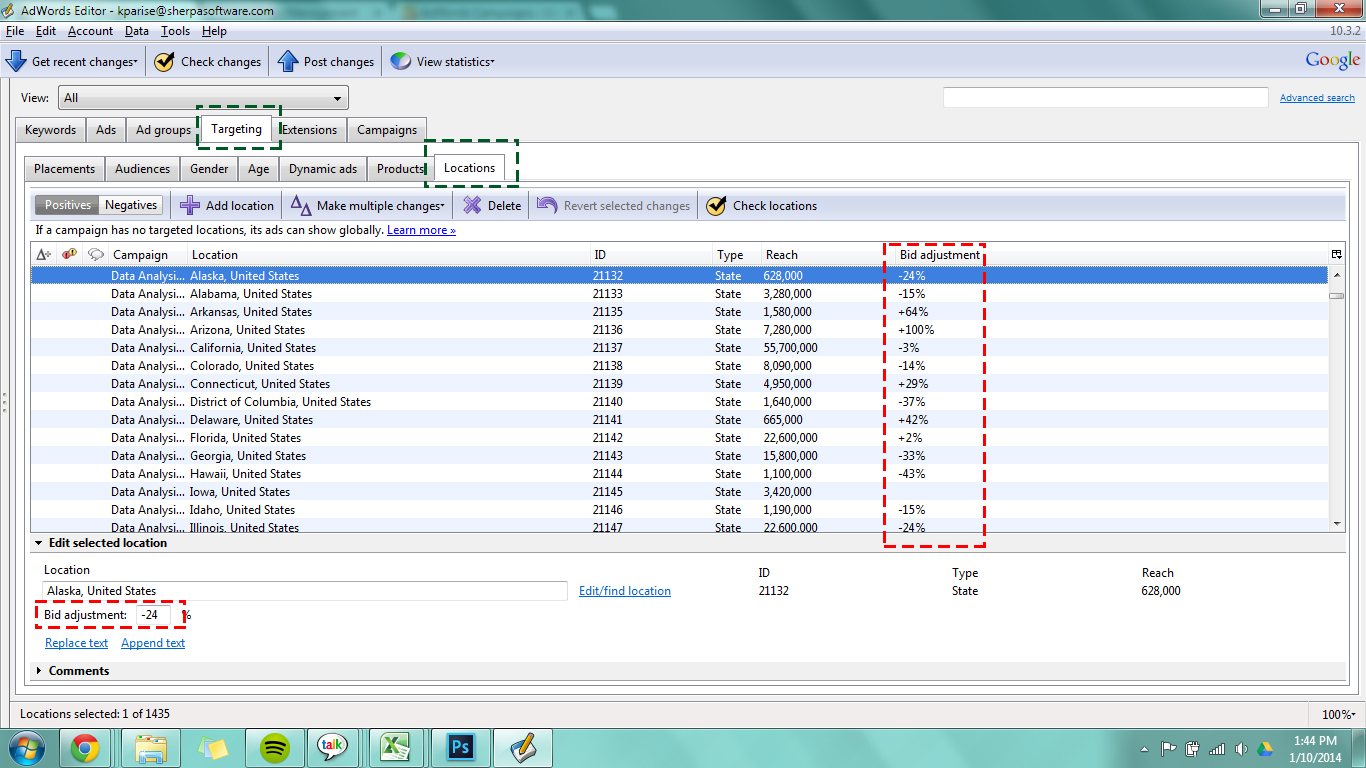
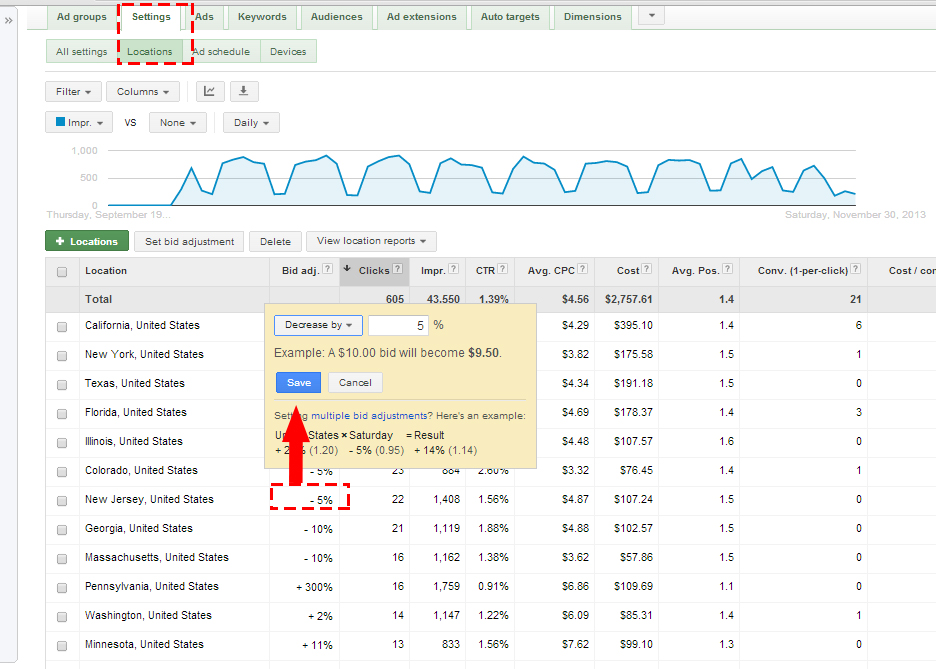
To find this bid adjustment in the AdWords User Interface, click on a campaign, then navigate to “Settings” and then “Locations”: Add you location, then click into the column called “Bid Adjustment” and apply the increase or decrease.
A Look at Some Real Data
In my first use of the location bid adjustments on a client I work with, I kept an eye on the data. Comparing the 14 days before and the 14 days after the change I saw:
Click Data:
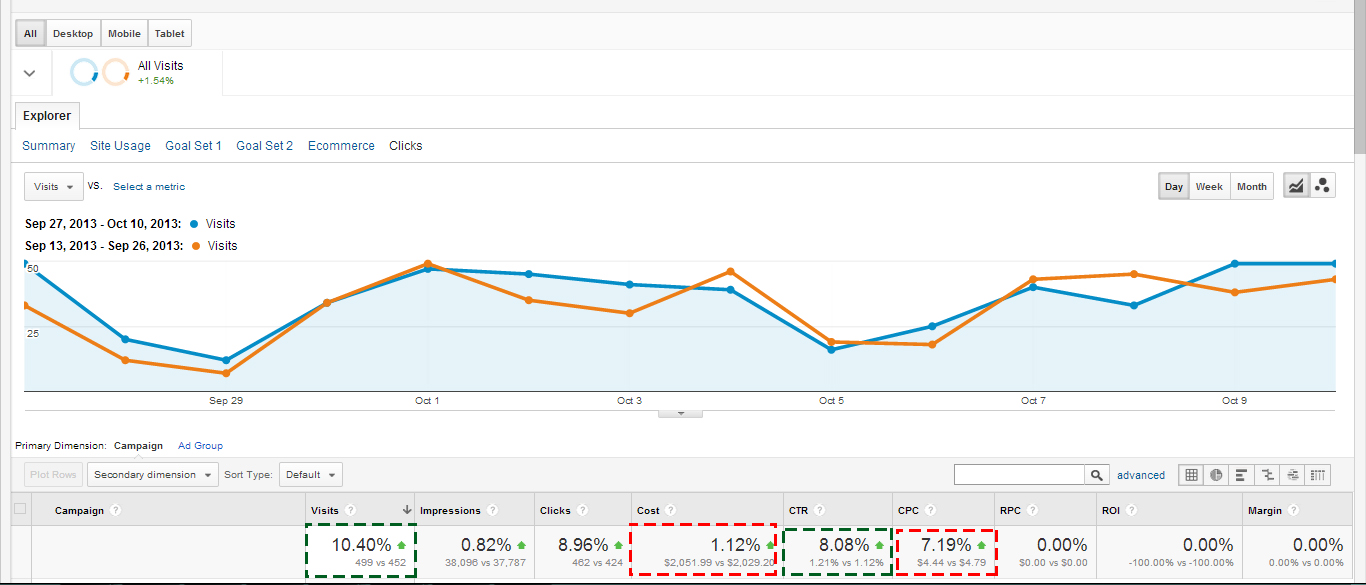
As you can see, we increased the CTR with these location bid adjustments and the overall number of Visits increased to the site. However, the drawback was an increase in CPC and a slight increase in Cost. Interesting though that the overall Cost/CPC increase didn’t increase at the same rate as the Visit increase.
Here is a snap of the Goal and Site Engagement:
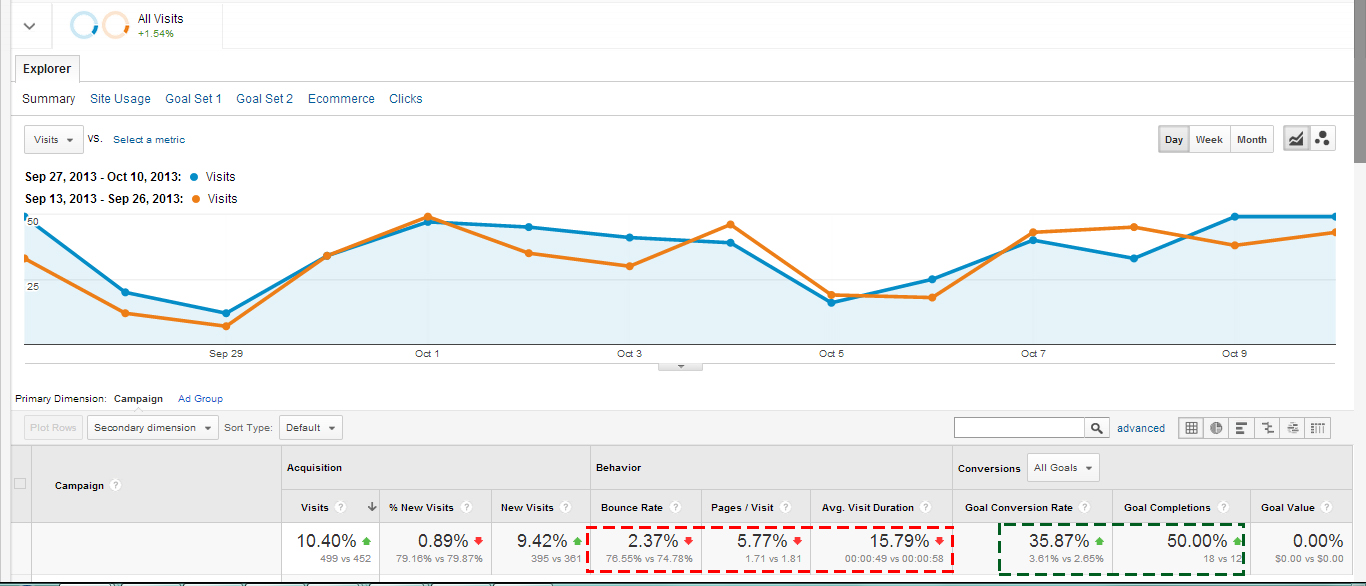
Looks like there was a good bump in # of Conversions and the Goal Conversion Rate (nice!), but there was a slight dip in the Site Engagement metrics. This prompts me to look more closely at the Campaign and Keyword specific data to see if there is something going on on those levels that changed these numbers so much.
There you have – a (not so) quick run down of how to use location bid adjustment and exactly where to get started. Sometimes all you need is a few markers before you see the rest of the trail! Let me know how you’ve used this feature to improve your campaigns – all ideas are welcome!


