Analyzing Changes To Your Site Navigation

The Problem
You just optimized the main navigation on your site to make it easier for users to find the more “popular” pages. But did the changes do the trick? Did they improve the user experience? Your boss is breathing down your neck to get answers to these questions.
The Solution
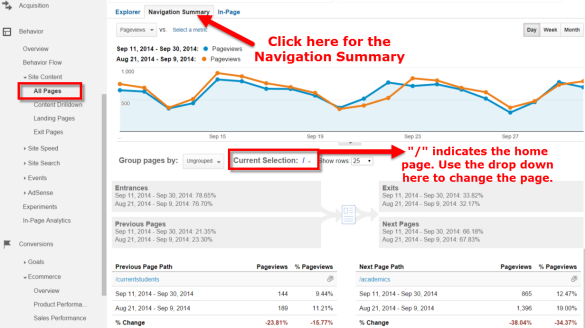
The Navigation Summary report in Google Analytics. This is a little-known report, tucked away in the Behavior > Site Content > All Pages report.
The Navigation Summary report is perfect for this type of analysis. It lets you choose a page (e.g. the homepage), and will show you the previous page a user was on before getting to that page, and the next page they went to. For example, we can focus on the homepage, and see where our users went next.
Step 1: Go to the Behavior > Site Content > All Pages report
Step 2: Click on the Navigation Summary tab (above the line graph)
Step 3: Choose the homepage (“/”) for the Current Selection
Step 4: Change your date range to begin after the navigation change. Then check the Compare to box to choose a comparison date range before the navigation change. (Be sure to line up the days so you’re comparing Mondays to Mondays, Tuesdays to Tuesdays, etc.)

Now your Navigation Summary report has transformed into a quick way to find out if certain pages are receiving a smaller share “clicks” from the homepage and if other pages’ share of “clicks” are increasing. I use “clicks” in quotes because it’s not really reporting clicks on links, but the percentage of pageviews of the page listed in the Next Page Path dimension.
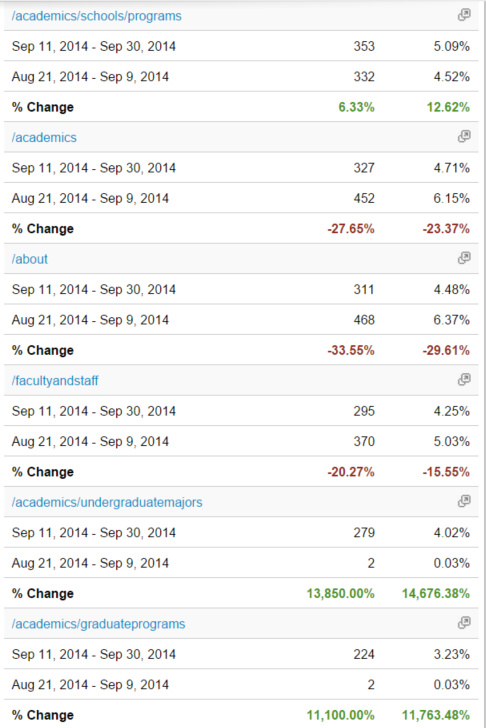
Take a look at the table of data on the right, which shows Next Page Path. Look for any big winners and losers here. Are there any pages which saw an increase? Decrease?

In the example above, the old navigation was a static list of links to the main sections of the site, with no drop downs. The new navigation still had the same static links to the main sections, but also revealed drop down menus (when mousing over) that showed the more popular pages within those sections.
By adding the drop down, it let users more quickly and easily get to the pages they were looking for directly from the homepage (1 click). Before, they would have had to click to a main section page, then look for the page from there (2 clicks).
Looking at the above, it’s easy to see that the first page (/academics/schools/programs) and the last two listed (/academics/undergraduatemajors and /academics/graduateprograms) all saw an increase in pageviews from the homepage. Meanwhile, other pages saw less pageviews from the homepage following the navigation update.
Caution: This report will show more than just changes to your navigation. It will reflect any links on the page as well (e.g. if you added a promotional banner on the homepage, you’d likely also see an increase to that page).
Other Considerations
This report is a helpful glance at the data and can be great to look at after the fact. If you know you’re going to be implementing navigation changes in the future – considering adding events to your navigation before and after, so you can measure the changes more clearly.