How To Report Custom Dimensions In Google Analytics

By now, reporting with custom dimensions is second nature for many of you. But for those who are new to Google Analytics, or who recently upgraded to Universal Analytics, we thought it was time to update our original post on how to access custom dimensions:
Published: September 10, 2013
Read on for three ways to build reports with custom dimensions. We share screenshots from the latest version of the GA interface and provide examples to spark ideas for your own use cases.
First, Collect the Data for Custom Dimensions
Since you can’t have reports without data, first make sure that custom dimensions are set up for your site.
Collecting data for custom dimensions requires two steps. (Step 1) Configure the dimensions in the admin interface. (Step 2) Implement code, on the page or in Google Tag Manager, to send data to your GA property. My colleague Amanda Schroeder covered the basics in her post about using custom dimensions to define audiences:
Published: March 17, 2015
You can start building reports as soon as the dimensions are configured (Step 1), but the tables will be empty until your GA property starts to receive the data (Step 2).
How will you know the property is receiving data? There are three different ways to see and report custom dimension data in Google Analytics.
1: Standard Reports with Secondary Dimensions
The quickest way to check for custom dimension data is to add a secondary dimension to a standard report. Immediately above the first column name in any report, click the button labeled Secondary dimension.

You may want to add a secondary dimension to the All Pages report if your custom dimension is related to page information and you want to see page metrics like Pageviews, Time on Page, etc.
To see session metrics instead of page metrics, start in the Acquisition or Audience section of reports where you get Sessions, Session Duration, etc.
Example 1-a: User Data, e.g. User Role
You have info in GA about your users (not personally identifiable, of course) and want to see how various user groups interacted with your site.
Let’s say you have a custom dimension named User Role, which you have collected and sent to GA when someone fills out a form on your site.
Start by adding a secondary dimension to the New vs Returning report (Audience > Behavior > New vs Returning). This report has only 2 rows and will produce the least complicated table for a quick check on your custom dimensions with user info.
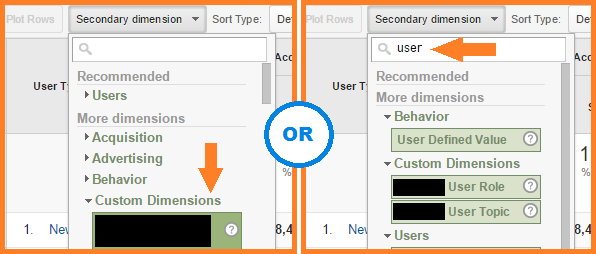
To navigate through the list of secondary dimensions, either expand the section titled Custom Dimensions, or start typing the name of the custom dimension, and make your selection.
Which groups send you more new users?
Adding User Role as a secondary dimension here shows that more of the site’s new users are students, followed by educators and then scientists.
You can also compare the numbers of new vs. returning sessions for each user group. Scientists had more return sessions than new sessions, while Educators had slightly more new sessions than return sessions.
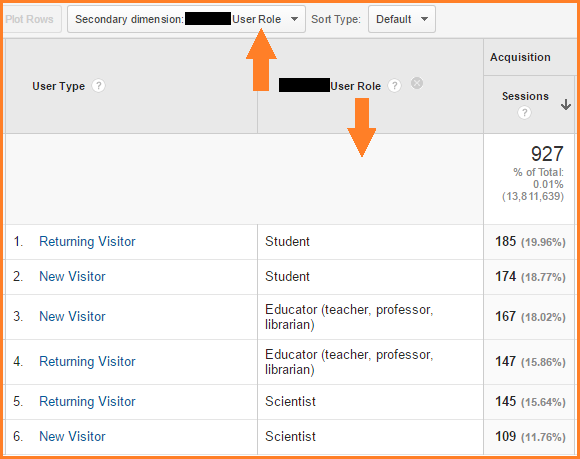
You can add custom dimensions like User Role to almost any report, for insight about the user groups that are relevant to your objectives. Here’s a meatier example:
What did users in each group search for?
The Search Terms report (Behavior > Site Search > Search Terms) can tell you what different user groups searched for, and whether or not those searches were successful.
For the first 5 search terms in this report, users found a search result they liked (sometimes after viewing multiple SERPs, i.e. “Results Pageviews / Search”). For example, a scientist searched for “biocides” and clicked through after viewing 4 SERPs, while a student searched for “weblands manual” and clicked through after viewing 1 SERP.
On the other hand, 2 students searched for “surplus food” or “cryptosporidium treatment” and exited the site without clicking any search results, even after viewing 7 to 10 pages!
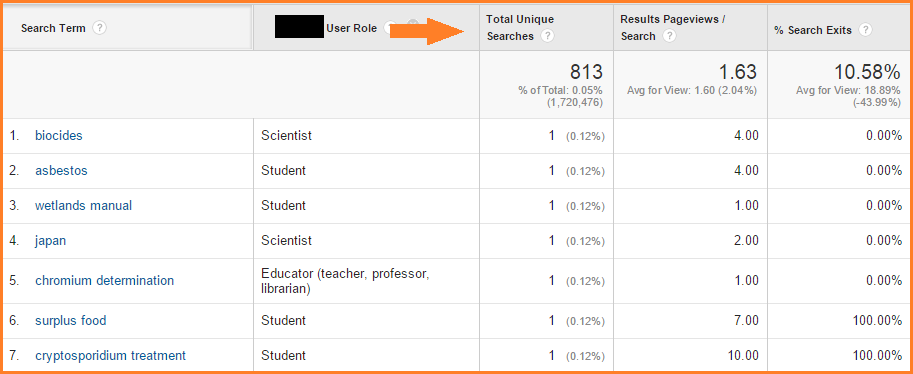
You can filter the report to show just the searches for one user group at a time (click the advanced link next to the search box). Export the data to Excel to perform more sophisticated analyses, grouping search terms by related subject matter, and so on.
Example 1-b: Page Data, e.g. Author
You have content associated with various authors. You collect and send a custom dimension titled Author to GA with every pageview.
Which authors have the most popular content?
Adding Author as a secondary dimension here shows you the authors of the posts with the most pageviews. Last month Reid Bandremer’s post about free SEO tools had the most pageviews.
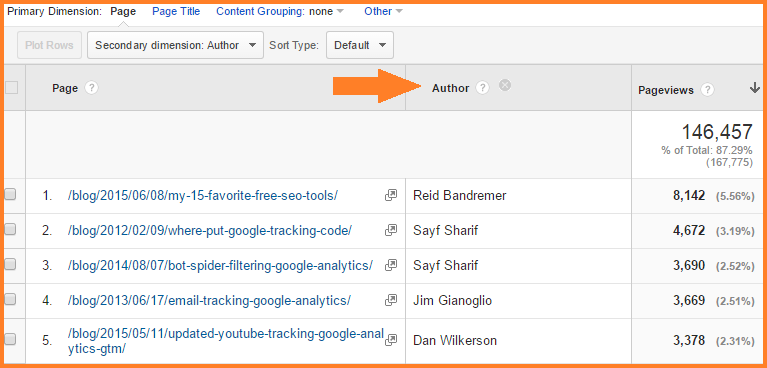
You could sort by other metrics, e.g. bounce rate, to see who authored the posts that persuaded users to read more pages on your site.
Which author’s posts keep users on site?
Last month Jonathan Weber’s blog post (from the previous summer!) had the best bounce rate. Users who viewed this post were the most likely to stick around and read other blog posts or pages related to Bounteous’ services.
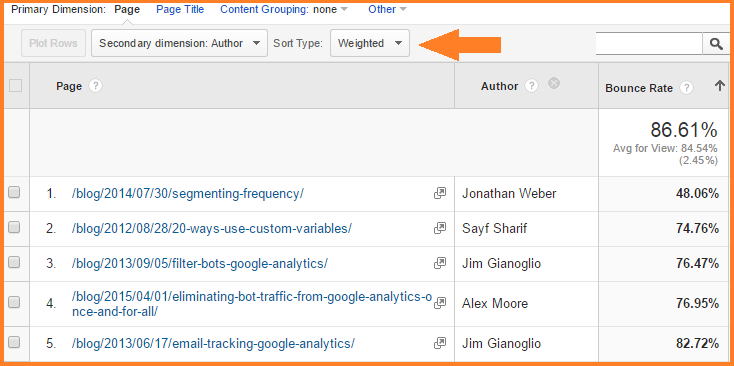
Use the weighted sort option (available when sorting by metrics that have percentages), which suppresses the rows with only 1 or 2 pageviews and lets the most significant data rise to the top.
2: Custom Reports and Dashboards
Another option for reporting custom dimensions is to use Google Analytics’ built-in custom reports. Custom reports are a good alternative to using secondary dimensions when:
- you want to see a custom dimension as your primary dimension, not a secondary dimension
- you want to see more than two dimensions per row (custom reports can have 5 dimensions per row), which is useful if you want to export the data table for further analysis
- you want to see metrics like number of users (not available in standard reports) for your custom dimensions
- you want to use custom metrics
Example 2-a: Session Data, e.g. Site Testing Variations
You could use a custom dimension to capture which test variation a user saw and combine it with the rest of your GA data. If you’re using Visual Website Optimizer, the dimension might be named something like VWO-56, which represents VWO test #56 (because you’re so awesome at testing your site you’ve already done 55 tests).
How did your test variations perform across sales regions and devices?
Combine your custom dimension for test variations with dimensions that further describe users in your test data. What sales region were they from? Were they on a mobile device? Then add metrics for context (how many users, how many sessions) and metrics for success (transactions, conversion rate), to create a report bursting with juicy details.
Choose a flat table type of custom report to present multiple dimensions side-by-side.
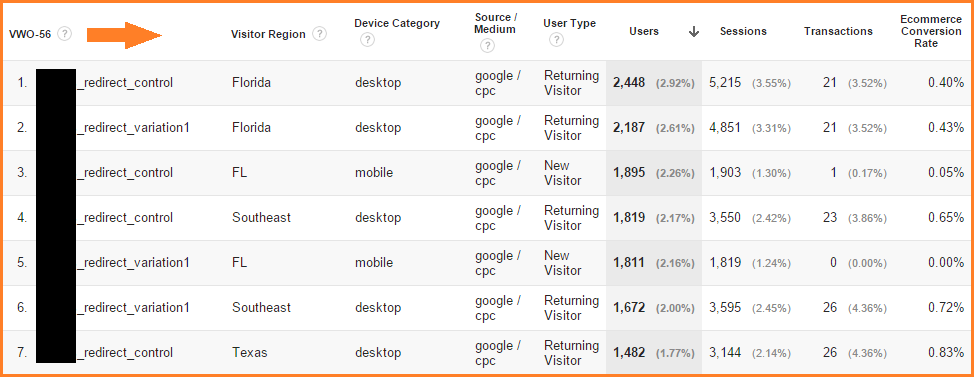
In the above example, Visitor Region is yet another custom dimension (that looks like it needs a little attention to the values Florida and FL). Device Category, Source/Medium, and User Type are all standard dimensions available out-of-the-box.
Notice we’ve added the elusive Users metric to this flat table custom report.
A table like this practically begs to be exported for further analysis using R or Excel. But you can do a lot with it right in GA, too, if you take advantage of the sorting and filtering tools in every table.
Or take it the other direction and present less detail, by placing a few high-level data points from your custom report on a custom dashboard. A flat table report doesn’t translate directly to a dashboard, but you can break it down into widgets and add them one at a time.
Look for the button at the top of the custom report that says, “Add to Dashboard” – GA will suggest a couple of widgets to get you started.
Example 2-b: Custom Metrics, e.g. Survey Scores
You may collect survey data on your site, and send the respondents’ scores to custom metrics in Google Analytics. Let’s say you have custom metrics like Navigation Score, Search Score, and Overall Satisfaction Score.
Which types of users give your site higher scores?
Do international or domestic users report higher overall satisfaction? Do new or returning users have an easier time with search or navigation?
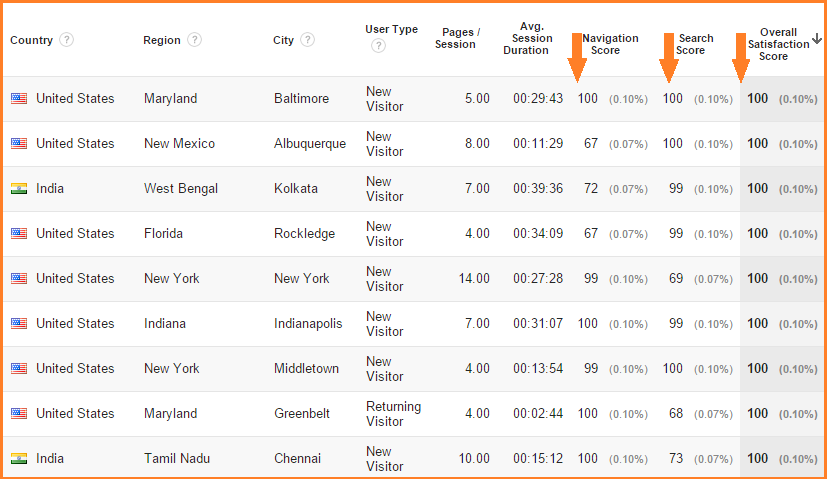
With custom reports, it’s easy to create large, complex tables out of your custom dimensions and custom metrics, which can then lead you to discover unexpected patterns in the data.
3: Use the Core Reporting API
Our third option for reporting custom dimensions is to use the Core Reporting API. You can create quick tables from the Google Sheets GA Add-On (Chrome extension) or from the Query Explorer, both using the API, without consulting a developer. Google keeps improving these tools and they are easier to use than ever.
Do you need to create recurring reports with customized features? The Google Sheets GA Add-On now has scheduling options. Automatically update your team’s shared spreadsheet every morning before they get to work, and they can check out the latest data for both standard and custom dimensions.
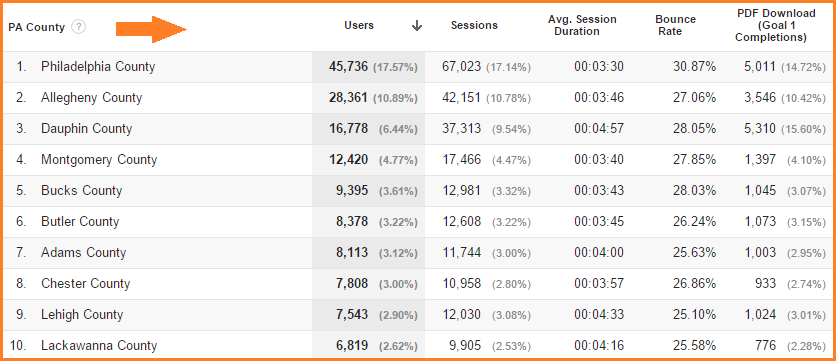
Example 3-a: Geographic Data, e.g. County (from IP)
For example, you could have data like PA County in a custom dimension. This county data could be sent to GA with hits from your site, or uploaded via GA’s data import feature.
How is your site serving users across counties?
Important metrics won’t always line up the same as your user population. Compare percentages of users by county to percentages of downloads by county, or other metrics relevant to your site’s objectives.
Get access to the underlying data from a custom report like this in GA:
By using the Google Sheets GA Add-On to query the GA Core Reporting API:
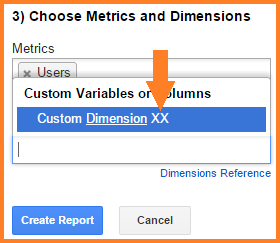
To see the above menu, first load the GA Add-On from the Chrome extension gallery, then choose “Create new report” and select your GA view. To access custom dimensions (or metrics), you will need to select “Custom Dimension XX” as shown above, and change the XX later. When you click “Create Report” you’ll see the “Report configuration” tab, which looks like the next screen shot below.
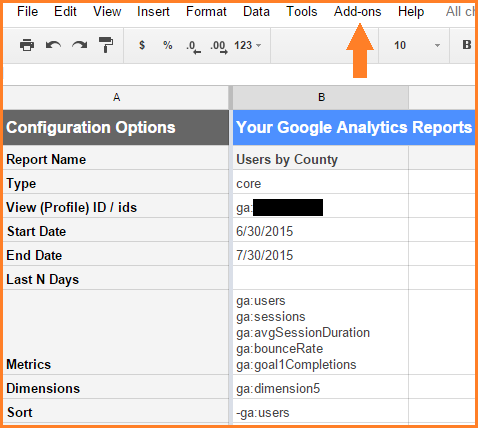
Edit your report configuration by changing the XX in “ga:dimensionXX” to the actual dimension index number, as in “ga:dimension5”. To find your custom dimension index numbers, go to the GA admin panel and look under Property Settings > Custom Definitions > Custom Dimensions.
If you need more custom dimensions (or metrics), just type them into the report configuration – you don’t have to go back to the new report wizard.
Finally, go to the Add-ons menu and select “Run reports” to create your table of data. The scheduling options are in the same menu.
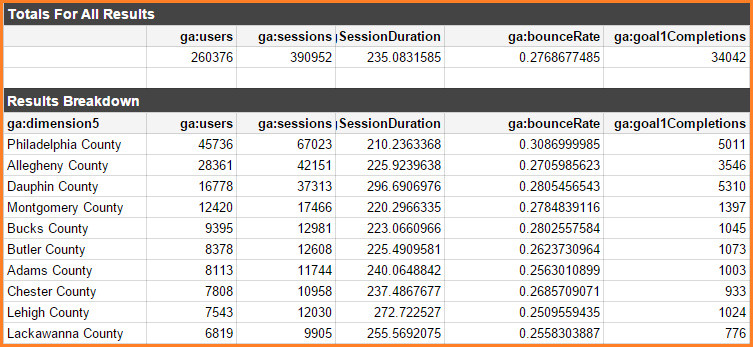
The results are presented along with a summary row at the top of the table, ready to be pulled into charts or combined with other data as you see fit.
Example 3-b: Browser Info, e.g. Ad Blocker Installed
For quick access to a table of data, use the Query Explorer. Maybe you have a custom dimension you’re using to capture whether users have an Ad Blocker installed, and you want to see how this relates to ecommerce conversion rates for those users.
Do users with ad blockers purchase more or less often than users without ad blockers?
Make your selections much the same way as in the Google Sheets GA Add-On. One exception: You don’t have to know the dimension index number, because the Query Explorer will look it up for you.
Just start typing the name of the custom dimension and the Query Explorer will refine the list of possible selections.
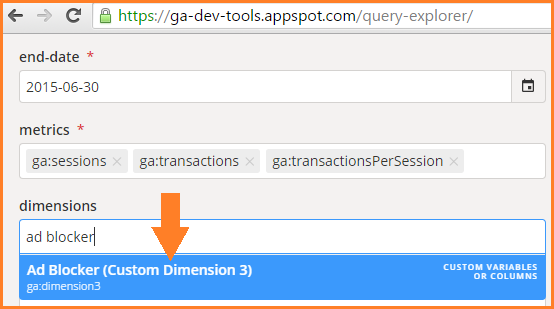
After completing the form, click the “Run Query” button to return a table of results like the one shown below, which is about as quick as creating a custom report.

Notice you have the option to download the results as a TSV file (a tab-separated-values file you can open in Excel).
Custom Dimensions Reporting Takeaways
Secondary dimensions are the fastest way to see custom dimensions in your GA data.
Custom reports let you build large, complex tables of data with custom dimensions as primary dimensions instead of secondary dimensions.
The Core Reporting API gives you access to custom dimension data to build your own charts and tables, via Google Sheets or the Query Explorer.
Published: August 28, 2012
What’s your favorite way to report custom dimensions? Do you have any interesting use cases to add to our examples? Please share in the comments.