New Calculated Metrics In Universal Analytics
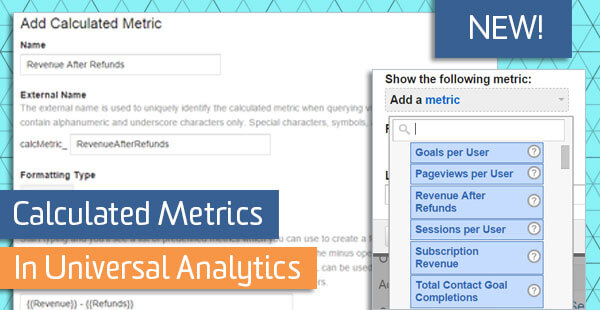
Finally, a long-awaited feature is available to all in Universal Analytics – calculated metrics! Google
Calculated metrics grant you greater flexibility in deriving insights by enabling you to perform basic calculations on metrics right there in the interface – without having to export data into Excel or another external program.
How to Create Calculated Metrics
Unlike custom metrics, calculated metrics are available at the View level, not the Property level:
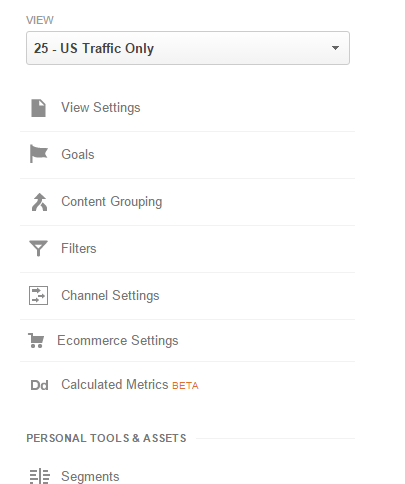
Only five calculated metrics are available per view, unless you have Google Analytics Premium, in which case you will have 50 available calculated metrics per view. (This is in addition to the 20 custom metrics in standard Google Analytics or 200 custom metrics in Google Analytics Premium)
To configure them, click “+ NEW CALCULATED METRIC” and enter a name, formatting type and formula. In the example below, we are subtracting refunds from revenue:

As you’ll see in the Formula section, basic operators are accepted and the metrics available appear with curly braces around them (just start typing in the field and your options will appear in auto-complete). Parentheses are also allowed (so you could add up the total of multiple goals, for example).
As you enter a Name for your calculated metric, a unique External Name will be created for you. This may be used for querying the via the Core Reporting API in the future, as mentioned in the description. You can edit the External Name, but it is not necessary to do so and you cannot change it once the calculated metric is created.
The formatting types available include Integer, Float, Currency, Time and Percent.
Using Calculated Metrics in Google Analytics
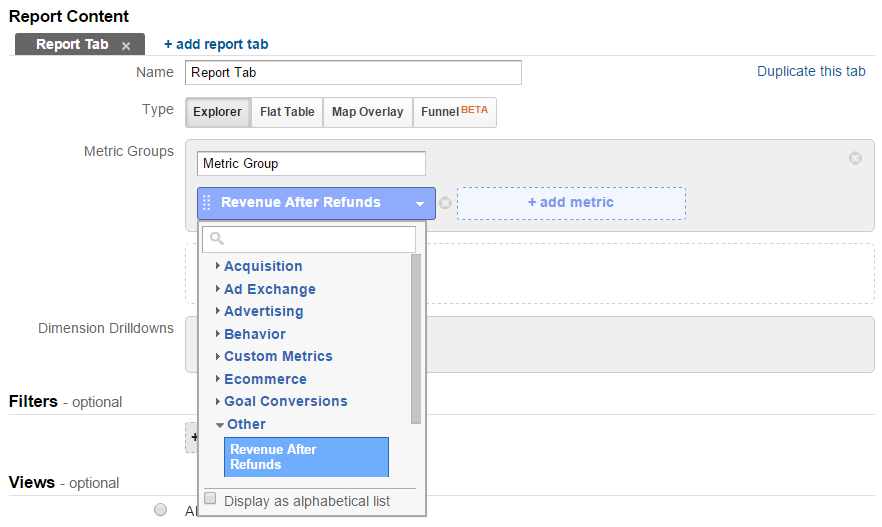
Calculated metrics can be applied in custom reports from under the “Other” category in the metrics drop-down list:
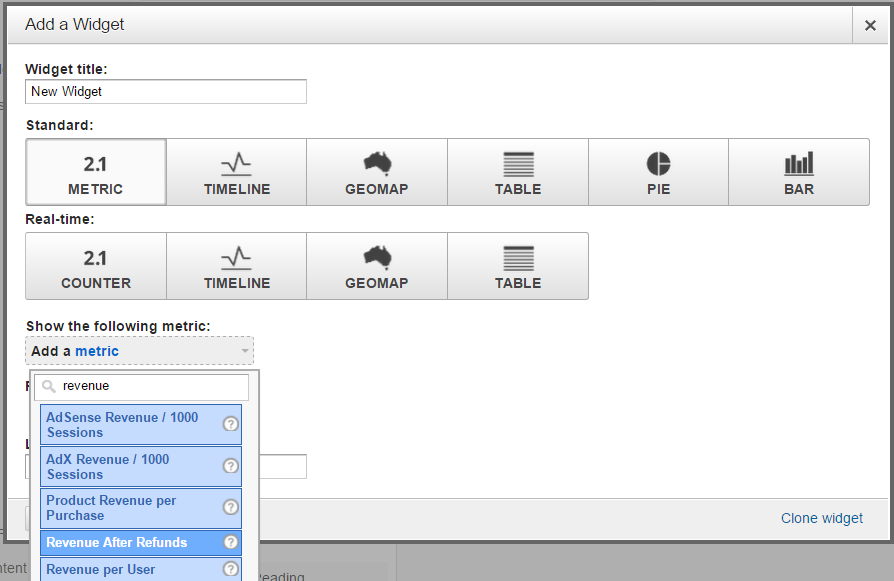
They can also be applied in Dashboard widgets:
Unfortunately, you cannot segment your standard reports with calculated metrics. (That would be awfully handy in some cases!)
Example Uses of Calculated Metrics
If you’re like most of us here at LunaMetrics, you’ve probably got a handful of use cases for calculated metrics already. Google suggests a few use cases, “Revenue Per User” and “Currency Conversion.”
Below are a few ideas from us to get you started!
Subscription Revenue
For subscription-based businesses, subscription revenue may be a useful metric. For example, you may have goals or events set up to capture new subscriptions and canceled subscriptions, which could then be used in a calculated metric. In this example, we have a goal value of $20 for subscriptions and a goal value of (-$20) for cancellations:
- Name: Subscription Revenue
- External Name: (automatically populated)
- Formatting Type: Currency (Decimal)
- Formula: {{New Subscription (Goal 1 Value)}} – {{Cancellation of Subscription (Goal 2 Value)}}
Revenue After Refunds
Additionally, the ecommerce reports in Google Analytics do not show a total revenue amount that accounts for refunds – but you can get that in the interface with a custom metric:
- Name: Revenue After Refunds
- External Name: (automatically populated)
- Formatting Type: Currency (Decimal)
- Formula: {{Revenue}} – {{Refund Amount}}
Total Goal Completions of Multiple Goals
If you have multiple Goals set up in Google Analytics that are similar in purpose, and you want to see the total number of those goal completions, you could add up the goal totals:
- Name: Total Inquiry Goal Completions
- External Name: (automatically populated)
- Formatting Type: Integer
- Formula: {{Contact – Phone (Goal 1 Completions)}} + {{Contact – Chat (Goal 2 Completions)}} + {{Contact – Email (Goal 3 Completions)}}
- Total Goal Starts of Multiple Goals
Similarly, if you want to see the total amount of goal starts (entrances to steps in goal funnels) of multiple goals, such as to compare to the above total goal completions of multiple goals, simply add up the total goal starts:
- Name: Total Inquiry Goal Starts
- External Name: (automatically populated)
- Formatting Type: Integer
- Formula: {{Contact – Phone (Goal 1 Start)}} + {{Contact – Chat (Goal 2 Start)}} + {{Contact – Email (Goal 3 Start)}}
Sessions per User
This metric is available via the Core Reporting API, but you can create a calculated metric for use in the interface if you want access to it in there as well:
- Name: Sessions Per User
- External Name: (automatically populated)
- Formatting Type: Integer
- Formula: {{Sessions}} / {{Users}}
Pageviews per User
Similarly to Sessions per User, we can find out the average amount of pageviews per user:
- Name: Pageviews Per User
- External Name: (automatically populated)
- Formatting Type: Integer
- Formula: {{Pageviews}} / {{Users}}
Other User-Based Calculations
Oftentimes when dealing with user-based metrics, you’ll want to also consider the kinds of users on your website. It is generally expected that all users will have sessions and pageviews, but not all users will have transactions, goal completions and/or events, for example. So if you want to configure metrics calculated based on users, it is important to consider what your users should look like. The following examples provide a little more background on this concept.
Goals per User
Say you’re interested in learning how frequently users are downloading PDFs across multiple sessions (are they finding your content useful, are they coming back for more??). You have a goal set up to track PDF Downloads and you want to use a calculated metric to find the amount of goals per user. Your calculated metric would probably look like this:
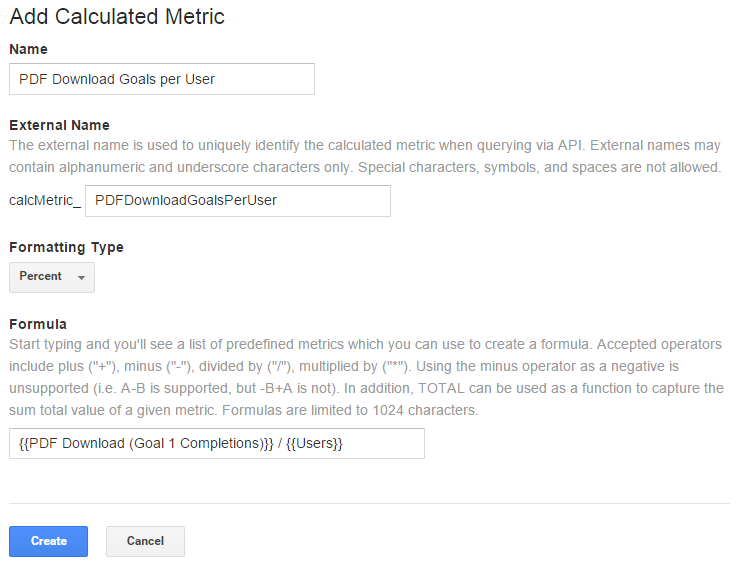
However, it is important to consider what “Users” can mean here. Taken literally, it means all users who have come to your website (in the time frame selected) – but you can customize this definition with a little extra effort. Essentially, two basic options we’re considering for the definition of “Users” here could include:
- Option 1: Look at all users – in other words, we’re asking “out of all users who have come to the site, how many PDF Download goals were completed?”
- Option 2: Look at only those users who completed at least one PDF Download – here, we’re asking “out of only those users who download PDF’s, how many of these goals did they complete?”
You will likely want to use Option 2 to calculate your new metric based on only those users who completed at least one PDF Download so that your result is not heavily skewed by all those other users who did not complete this goal.
To do this, you will still keep your {{Users}} metric in your calculated metric formula – but you will need a little extra information as well in order to filter those users in a custom report: you need to identify those users who have downloaded at least one PDF with a user-level custom dimension.
For example, let’s say we have a custom dimension that is applied as soon as a link is clicked on the website that opens a PDF – we’ll call these users “PDF Downloaders.” With this custom dimension, we can filter our users in our custom report, which may look like this:
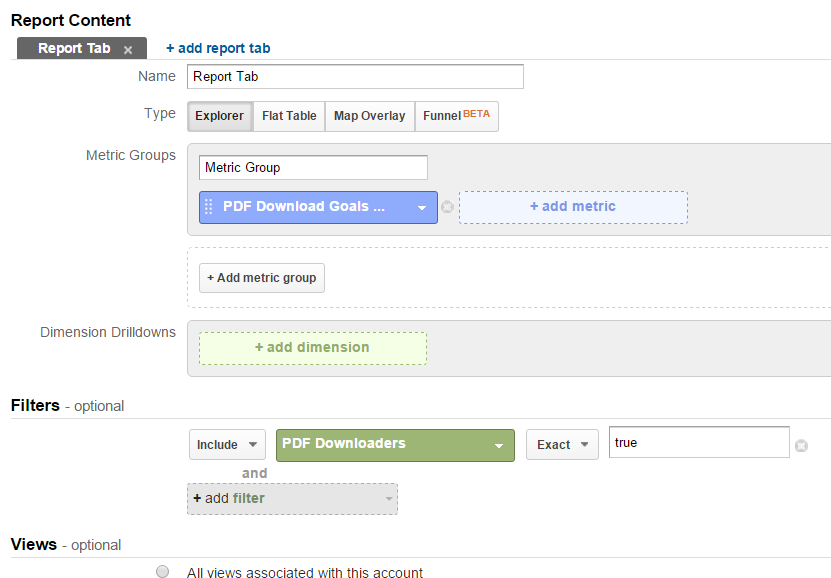
Here, “PDF Download Goals per User” is our calculated metric and our “PDF Downloaders” custom dimension is applied as a filter.
We could also get the total number of PDF downloads with an event instead of a goal, but we would need to use {{Total Events}} instead of {{PDF Download (Goal 1 Completions)}} in our calculated metric formula and then filter the custom report to specify the event category of PDF Download.
Transactions per User
Similarly to PDF Downloaders, we could create a custom dimension for users with transactions, which we could then use to filter a custom report based on the following calculation for transactions per user:
- Name: Transactions Per Session
- External Name: (automatically populated)
- Formatting Type: Integer
- Formula: {{Transactions}} / {{Users}}
Total KPI’s per User
How many KPI’s/events were completed by total users? The following will give you an average of users with events:
- Name: Events Per User
- External Name: (automatically populated)
- Formatting Type: Integer
- Formula: {{Total Events}} / {{Users}}
In a custom report, you could then filter to a specific event category if you wanted to see only certain events per user, such as video plays.
However – if you want a more specific number based on only those users who engaged with an event, you would again need to filter the users with a custom dimension:
- Name: Events Per Users with Event
- External Name: (automatically populated)
- Formatting Type: Integer
- Formula: {{Total Events}} / {{Users}}
Have you used calculated metrics yet? What are some useful calculations you have found?


