It’s Your Google Analytics Data, (Custom) Report What You Want
Standard reports in Google Analytics provide extensive amounts of data. By exploring these interactive reports and leveraging their endless combinations of dimensions and metrics, you can gain valuable insight into your audience and its behaviors, your website performance and conversion/ecommerce processes.
But maybe you’ve spent more time than you’d like to admit filtering, segmenting and pivoting data in the standard reports. And sometimes, after you’ve wrangled the reports into something passably presentable, you’re left a little disappointed and unfulfilled, because it still isn’t EXACTLY what you (or your boss, board members, or client) wanted. There are still too many metrics that are out of focus for your website and company goals.
The way to get exactly what you want – at least when it comes to Google Analytics reporting – is Custom Reports. Custom Reports allow you to use the metrics and dimensions found in standard reports, but you can tailor them so they include only the most important information for your business. Streamlined, relevant reports for everyone!
Before we get to our examples, here’s a quick review. There are four types of Custom Reports:
- Explorer
Explorer-type reports allow dimensions drilldowns. This interactive report style is the default for almost all built-in Google Analytics reports. - Flat Table
Flat tables allow up to 5 dimensions in a single row, which is helpful for very targeted and detailed analysis at a glance. It’s not the fanciest of the report types, but it really gets the job done. - Map Overlay
This type of report replicates look of Geo Reports. Helpful if you enjoy visuals and a little more interactivity. - Custom Funnels (Premium Only!)
Custom Funnels reports are a Google Analytics Premium (360) feature only. They allow Enhanced Ecommerce like Funnels for user-defined paths and allow you to better visualize the engagement flow for users and sessions across your site. Check out a full comparison of features between Premium and the free version.
To get you started, here are a few basic ideas for Custom Reports. I’ve used flat tables for these, but you could definitely experiment with the other types.
Custom Report #1: Event Interaction by Category, Action & Label
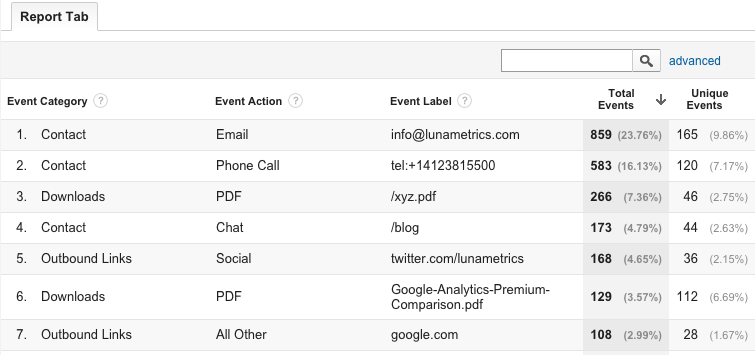
With this Custom Report, you can view all events by category, action, and label dimensions, alongside their total and unique numbers. In a standard report, you could only choose 2 dimensions.
This report provides a high-level overview of how often users are interacting with your site, allowing you to compare one event category to another, or compare individual events within the same category. You can also troubleshoot at a glance, identifying any events that aren’t getting any interactions or if there is any unusual discrepancy between total events and unique events.
This report is valuable for industries where user engagement is important (so, really, all industries), but is especially helpful for lead generation sites.
Set it Up:
Import this report into your own Google Analytics from the Solutions Gallery.
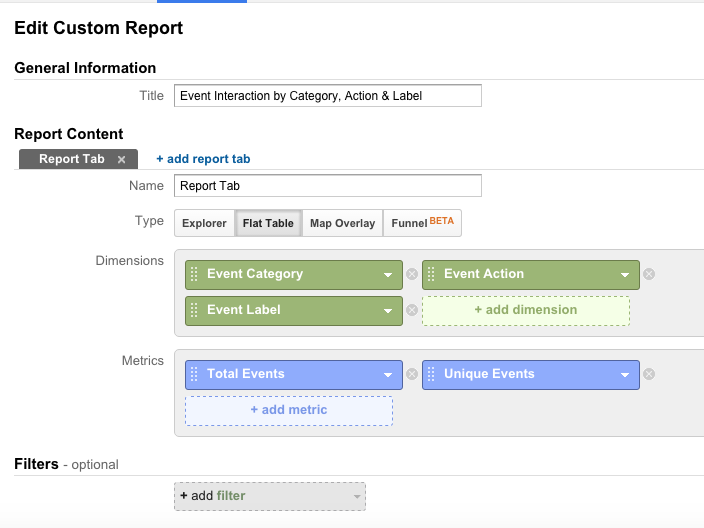
To set this report up manually, navigate to the Customization section, then create a new report. Choose the following dimensions and metrics and set a filter if you’d like.
Custom Reports #2 & #3: Metrics by Day of Week Name & Time of Day
Metrics by Day of Week Name
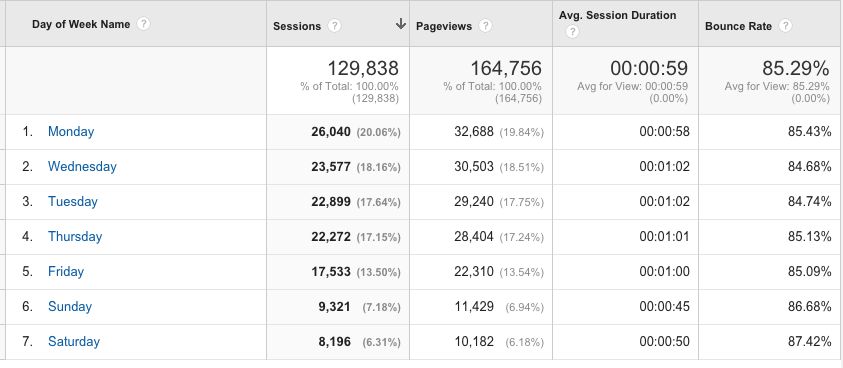
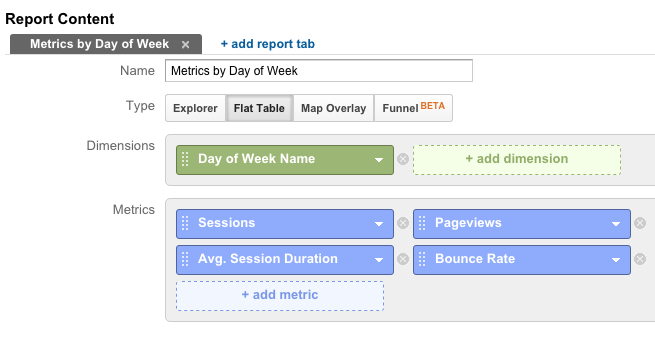
Used in Custom Reports, the Day of Week Name dimension is pretty self-explanatory—it allows you to compare metrics by day of the week, and it displays the actual names of the days instead of numbers. For this basic Custom Report, I just used a few familiar metrics, but you could add or swap this out for anything else.
Goal completions would be a great metric to use in this Custom Report, or if you’re an ecommerce site, you could view transaction-based metrics.
For publisher or content sites, this report can provide insight into which days users are consuming content. From these trends, you may choose to feature more important content on certain days of the week.
Set it Up:
Create another new Custom Report. Choose the following dimensions and metrics (I used another flat table for this example).
Metrics by Time of Day (Hour)
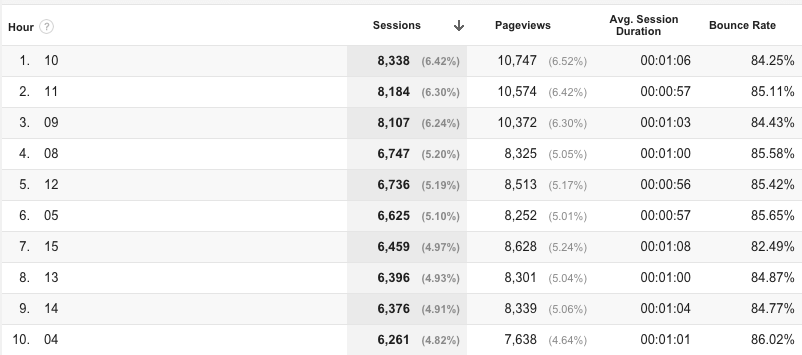
For an even more granular breakdown than day of the week, Google Analytics provides the Time of Day dimension that can be used in Custom Reports. Alongside a days of the week comparison, the hour metric is valuable if you’re publishing several pieces of content throughout the day and want to make sure you reach the widest or most engaged audience.
As you can see in the sample report below, the hour dimension values range from 00 to 24. Remember, this report is based on the time zone you’ve chosen in your Google Analytics View settings, so make sure to check that this is correct.
Set it Up:
Modify your original Day of Week Name report by changing the dimension to Hour.
Metrics by Day of Week Name & Time of Day
Import this report from the Google Analytics Solutions Gallery.
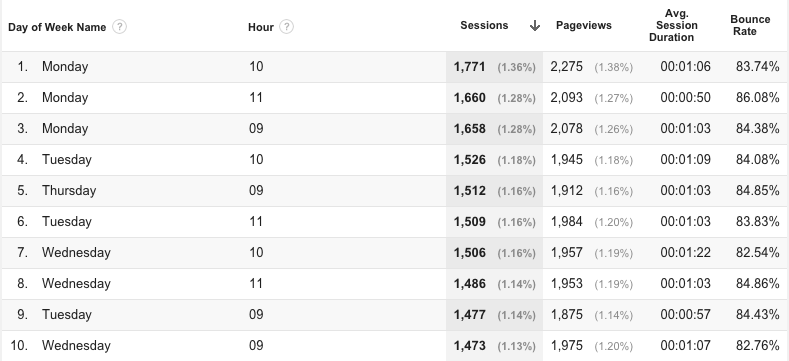
You can easily use the day of week and time of day dimensions the same report, which shows you exactly which day and time had the most pageviews, transactions, or conversions over a certain period of time. Just modify your Day of the Week Name report to include a second dimension for Hour.
Custom Report #4: Metrics by Browser, Browser Version & Operating System
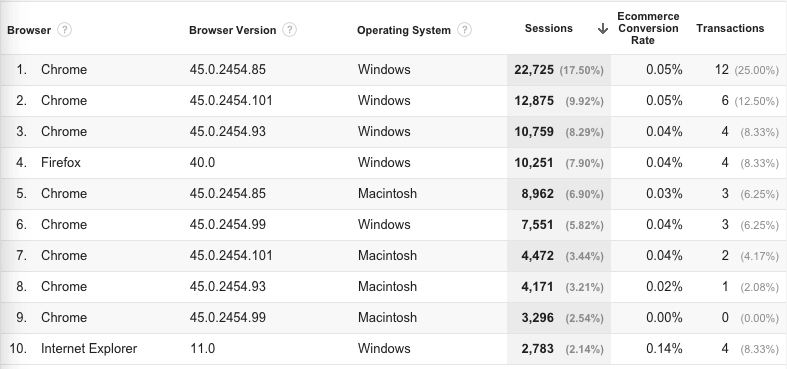
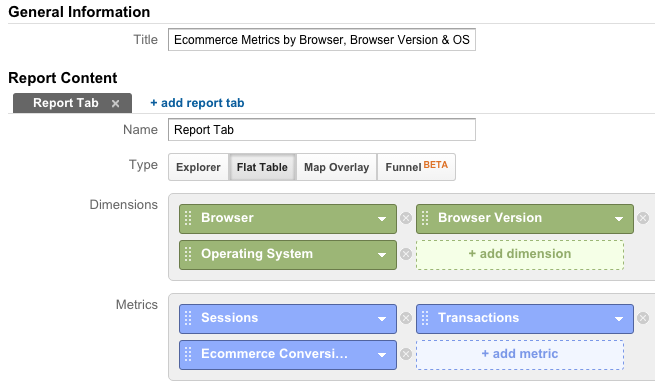
This is an extremely useful report for ecommerce sites, but can be used for other industries as well. Since Custom Reports allow you to add several dimensions, this report provides detailed information about users’ browsers and operating systems in relation to transactions. This data can help you identify which browsers, browser versions, or operating systems may be causing major issues with transactions.
In the sample report below, we can see that there are zero transactions for Mac users visiting the site using Chrome version 45.0.2954.99, though the number of sessions is comparable to other top browser and operating system combinations. While the ecommerce conversion rates and number of transactions are all relatively low in this instance, larger differences could signal the cause of missing ecommerce data.
Set it Up:
Import this report from the Google Analytics Solutions Gallery.
Using the flat table option, choose the following dimensions and metrics. For non-ecommerce sites, consider looking at events or conversions. Some older browsers may have problems displaying certain types of interactive content like forms or widgets.
Custom Report #5: Site Speed Metrics by Browser & Browser Version
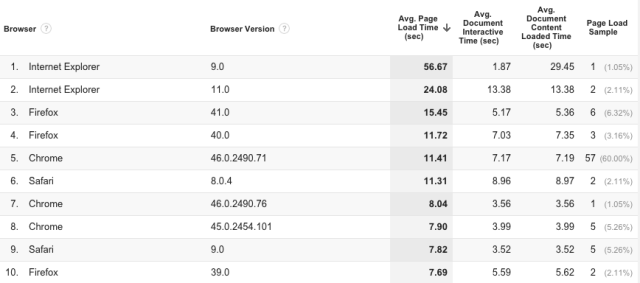
The last Custom Report I’m sharing is helpful for anyone concerned with user experience. So in other words, anyone with a website that other people are using! This report focuses on Site Speed metrics by browser and browser version, so you can really identify which browsers are causing slow load times. Sam wrote a really great, in-depth post on the different Site Speed metrics, so make sure to read it to understand how to use this report for analysis.
Set it Up:
Import this report from the Google Analytics Solutions Gallery.
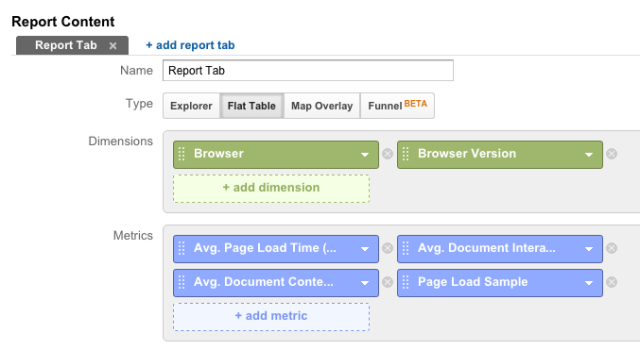
Using the flat table option, choose the following dimensions and metrics. You could choose to add more or different Site Speed metrics as well.
Summary
Custom Reports are like the decorative icing (or at least one of the decorative icings) on the Google Analytics cake, letting you customize your data to make it even more relevant for the audiences viewing the reports. Using multiple dimensions instead of the default secondary dimension provides even more flexibility. Plus, just like with standard reports, you can also set Custom Reports to be emailed at regular intervals.
So don’t wait—start experimenting with Custom Reports today!


