Connecting DoubleClick For Publishers To Google Analytics
Extra! Extra! Read all about it!
For online publishers, it’s now possible to integrate your DoubleClick for Publishers (DFP) data directly into Google Analytics (GA). Much like advertisers can link their AdWords or DoubleClick Campaign Manager (DCM) accounts to GA, this feature has now been rolled out for DFP.
What is DFP?
For the curious non-publishers reading this post, DFP is analogous to AdSense. It’s a way for online publishers to serve ads on their sites. DFP comes in two flavors: DFP Premium and DFP Small Business. You can learn more about it here.
Benefits
Why should publishers care about this? Don’t they already get all the reporting they need from DoubleClick?
There are two main benefits of this integration that should have publishers lining up:
- Audience sharing
- Better reporting
Audience Sharing
With this integration, you can create audiences based off your GA data and share them with DFP. For example, you could create an audience of “sports enthusiasts” that would include users who have viewed 5 or more pages in the sports section of your site.
Or you could identify highly engaged users. For example, users who spend longer on your site or who take specific actions (watching a video, submitting a form, etc.).
Or you could think about all the data you’re collecting and storing in custom dimensions. Maybe you have a custom dimension that tracks a user’s lifetime value. You could create an audience of high-value users.
This does require using DFP Audience, which is included in DFP Premium or can be purchased separately.
Better Reporting
By pulling your DFP data into GA, you’ll be able to combine it in ways never before possible. There are 10 DFP metrics that you’ll see:
- DFP Impressions – A DFP ad impression is reported whenever an individual ad is displayed on your website. For example, if a page with two ad units is viewed once, we’ll display two impressions.
- DFP Coverage – Coverage is the percentage of ad requests that returned at least one ad. Generally, coverage can help you identify sites where your DFP account isn’t able to provide targeted ads. (Ad Impressions / Total Ad Requests) * 100.
- DFP Monetized Pageviews – Measures the total number of pageviews on your property that were shown with an ad from your linked DFP account. Note – a single page can have multiple ad units.
- DFP Impressions / Session – The ratio of DFP ad impressions to Analytics sessions (Ad Impressions / Analytics Sessions).
- DFP Viewable Impressions % – The percentage of ad impressions that were viewable. An impression is considered a viewable impression when it has appeared within a user’s browser and had the opportunity to be seen.
- DFP Clicks – The number of times DFP ads were clicked on your site.
- DFP CTR – The percentage of DFP impressions that resulted in a click on an ad.
- DFP Revenue – DFP revenue is an estimate of your total ad revenue based on impressions served.
- DFP Revenue / 1000 Sessions – The total estimated revenue from DFP ads per 1000 Analytics sessions. Note that this metric is based on sessions to your site and not ad impressions.
- DFP eCPM – The estimated cost per thousand page views. It is your DFP Revenue per 1000 pageviews.
In addition to these 10 metrics, you’ll also see equivalent metrics for DFP backfill ads (AdSense or Ad Exchange) that you may have configured in your DFP network.
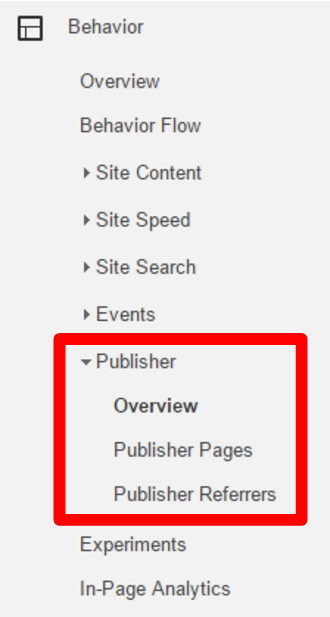
There are three reports under the Behavior section that give you DFP-specific information:
- Publisher Overview Report
- Publisher Pages Report
- Publisher Referrers Report

Publisher Overview Report
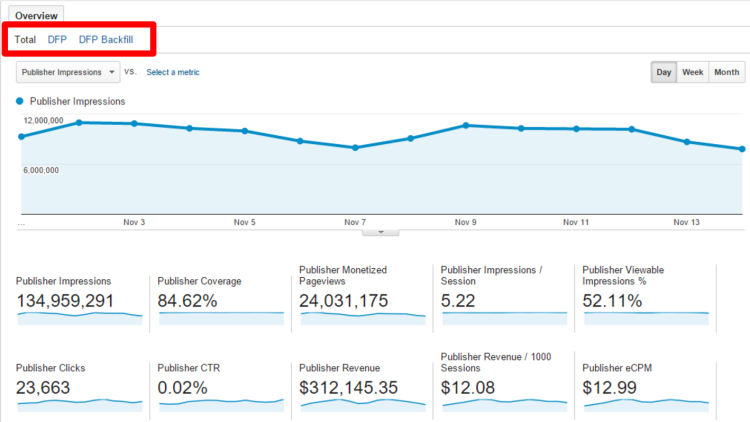
The Overview report gives a high-level summary of the key metrics. By default, the graph in the report displays the daily total Publisher Impressions for your site. You can switch metrics groups from Total to DFP to DFP Backfill.

Publisher Pages Report
The Publisher Pages report provides data about which pages on your site contributed the most DFP impressions, clicks, revenue and more. If you want to know which pages on your site earn you the most money, this is the report for you!
Publisher Referrers report
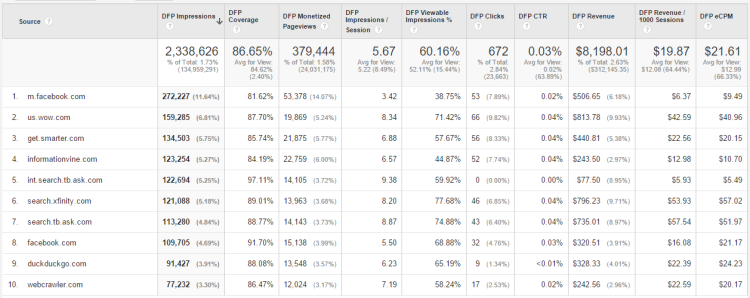
The Publishers Referrers report shows you the referring sites that contributed the most DFP impressions, clicks, revenue, etc. to your site. If you’re wondering how valuable Facebook is compared to other sources of traffic, this is a great place to start.

Custom Reports
You can even go beyond just the standard Publisher reports and build your own, custom reports using these DFP metrics. For example, you can take the Acquisition > All Traffic > Channels report and add in your DFP metrics to see which channels of traffic are most valuable.
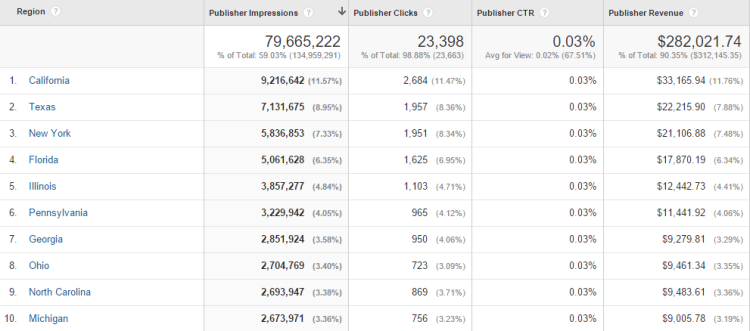
Or, you could load these metrics alongside the Region dimension to see which states/regions drive the most ad revenue.

How do I get all this DFP reporting goodness?
There are a few prerequisites to enabling this integration. First of all, you have to be using Google Analytics 360. Secondly, you have to be primarily using Google Publisher Tags (GPT), and they need to be placed directly on the page (not in an iframe).
There are a couple other caveats worth noting:
- Only DFP ads served via GPT are supported at this time. Video ads and ads served via the mobile SDK are not eligible.
- Historical DFP data will not be available in GA, only from the time of the integration moving forward.


