A Better Way To Connect Tableau And GA

Good news! Your data viz designs are now free from the limitations of Tableau’s native Google Analytics connector. Tableau’s new Web Data Connector will grab your data from Google Sheets, where you can take advantage of the Add-On for Google Analytics.
Why Is It Better?
Within your Google Sheet, you can build a single data table from queries with the full functionality of the Google Analytics API. This means:
- You can filter your data before connecting to Tableau, to avoid pulling more than the 10,000-row limit
- If you need more than 10,000 rows, you can write a second query with a start index of 10,001, and so forth
When you build a single data table from multiple queries, you can also:
- Get around sampling: pull data over smaller date ranges and re-combine
- Combine data from different GA sources, e.g. hotels each with their own GA accounts
- Correct a subset of data: query a small date range with a segment and replace rows in main table
How Does It Work?
The Google Spreadsheet Add-On for Google Analytics returns a separate tab of data for each query. Combine the data you want from each tab and make a new tab, forming a single data table which can connect to Tableau.
Now you’re ready to use the Web Data Connector. Let’s walk through it step-by-step.
Step 1: Create a new data source
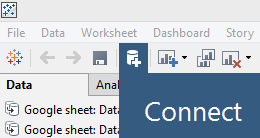
Click the cylinder-plus icon, CTRL+D, or go to Data > New Data Source > More Servers and scroll all the way down to select Web Data Connector.
Enter http://localhost:8888/GoogleSheetsConnector.html into the dialog box.

Important: The very first time you set this up, you’ll need to (a) download the Web Data Connector SDK and (b) enable Internet Information Services (IIS).
Step 2: Get a share link from Google Sheets
Click the blue “Share” button at the top right of your spreadsheet and select “Get shareable link” to copy the link. Paste the link into the dialog box in Tableau and press the “connect” button.

Step 3: Authorize Tableau to access your data
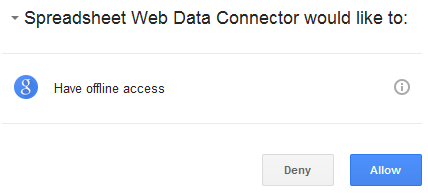
Click the link that says, “Click to grant access” and follow the prompts. You may be asked to sign in to your Google account, after which you’ll see another screen with a blue “Allow” button. Click that button.

Step 4: Choose the sheet to use as data source
Once Tableau has accessed your Google Sheet, it will list all the tabs (Tableau calls them “sheets”). Select the one you want to use as your Tableau data source. Wait for a minute or two while Tableau creates an “extract” of your Google Sheet data.

Step 5: Verify and filter data (optional)
At this point you can verify that your data source is a table with more than 10,000 rows. Go to Data > [Data Source Name] > View Data and then edit the box that says 10,000 rows. For example: Replace 10,000 with 50,000 or anything higher than the number of rows you expect. Tableau will then display the exact number of rows.

You can also filter data from the Data menu if needed. Go past “View Data” – scroll down to “Edit Data Source Filters” and follow the prompts.
Now your data visualizations can be based on a complete set of unsampled data!
What About Data Updates?
The Google Spreadsheet Add-On for Google Analytics lets you schedule regular updates of data from the API. So however you choose to refresh data in Tableau, your Google Sheet can always be ready.
It’s even possible to use dynamic date ranges relative to today. In your Google Sheet, the queries can contain formulas, which update automatically depending on what day it is.
Using Google Sheets to work around the limitations, the possibilities seem nearly limitless!
Have you tried connecting Tableau with GA via the new Web Data Connector? Do you have any questions? Or any tips based on your experience? Please share in the comments.


