Getting Started With Google Optimize

A few months ago, Google announced that it would be offering a free version of Google Optimize 360 to the public. This month, people who requested an invite to Optimize will begin to receive access to the tool. If you have access, this article will help you get started. If you would like to sign up for Optimize, but have not requested an invite yet, you can do so here. Google is granting access on a first come first serve basis through early 2017.
What is Google Optimize?
Google Optimize 360 is Google’s A/B testing and personalization platform. Like most A/B testing platforms, it allows marketers to test variations of a site in order to improve conversions. Unlike most A/B testing platforms, it natively integrates with Google Analytics.
Google Optimize (free) vs Google Optimize 360
Google has a great comparison chart for what is included in each package. Here I will simply explain the limitations of the free version.
No audiences. Optimize 360 allows you to use Google Analytics audiences to target which users will be included in your experiment. The free version does not. If you are looking to make sure only relevant users see your experiment, you’ll need to use a combination of other targeting options Optimize offers.
Limited Concurrent Experiments. The number of concurrent tests you can run is capped at 3. This shouldn’t be a problem for small and medium sized sites that are just getting started with A/B testing. But larger, more experienced teams may find this to be a real handicap.
Limited multivariate testing. The free version of Optimize does offer multivariate testing, but multivariate tests are limited to 16 variations.
Pre-selected Objectives. One of the great features of Optimize 360 is the ability to see how an experiment would have impacted other GA goals by retroactively changing experiment objectives. It can do this because objectives are actually GA goals, which are pulled from the view you tied to the Optimize container.
How is Google Optimize Implemented?
Updated: As Google Optimize matures, we’ve seen shifts in recommendations for how to implement it on your site. Many options exist, but the recommended way to add Optimize to your site is by adding a line of code to the Universal Analytics snippet installed on your website. The general process for setting up Google Optimize looks like this:
- Create an account and container
- Link the container to Google Analytics
- Install Google Optimize on the site
We cover this and other elements of installing Google Optimize in this blog post:
Published: March 2, 2017
Creating Your First Experiment
Creating your first experiment is very simple.
1. From the Optimize Container page, click the blue “Create Experiment” button.

2. Enter your experiment name, editor page, and the type of experiment you would like to run. The editor page is the page you will make modifications to using the visual editor. For example, if you’re running and experiment on blog pages, enter one blog entry URL. Later you will use experiment targeting to apply your changes to some or all of your blog posts.
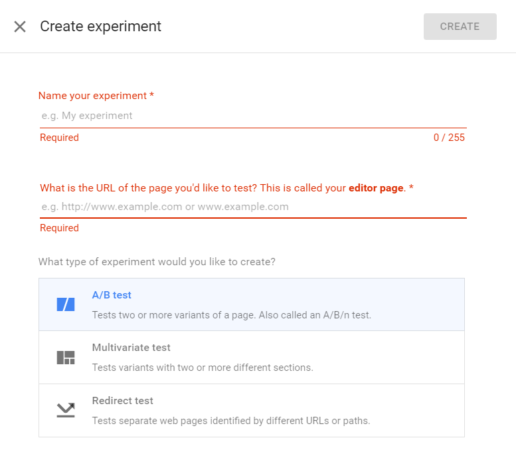
3. Select the type of experiment you would like to run. You have three basic options here:
- A/B Test. Tests two or more variants of a page, also called an A/B/N test. This is the most common of the experiments.
- Multivariate Test. Tests variants with two or more different sections on the same page (or page template). This is great for when you want to try multiple combinations of elements on the same page (or page template).
- Redirect Test. Test separate web pages identified by different URLs or paths. If you’re making large changes to page code it can slow down the page. If you find yourself in that situation, it’s better to run a redirect test. Don’t forget to add a noindex tag to the test page.
Experiment Interface
For the rest of this blog post we will focus on an A/B test. Let’s dive into the experiment interface.
There are two main tabs, “Details” and “Reporting”. Details is where you’ll be able to find and modify experiment information, Reporting is where experiment data is reported (it’s also reported in GA).
There are two main sections here: variants and configuration.
Variants Section

Variants is where you’re able to see:
- How many variants are in your experiment
- What percentage of traffic each variant will receive (an even split is recommended)
- Options for previewing how the experiment will look on desktop and mobile. It is also where you can generate a preview link for your team.
- Number of changes made to the variation.
- Additional options which include edit variant name and delete variant.
Configuration Section
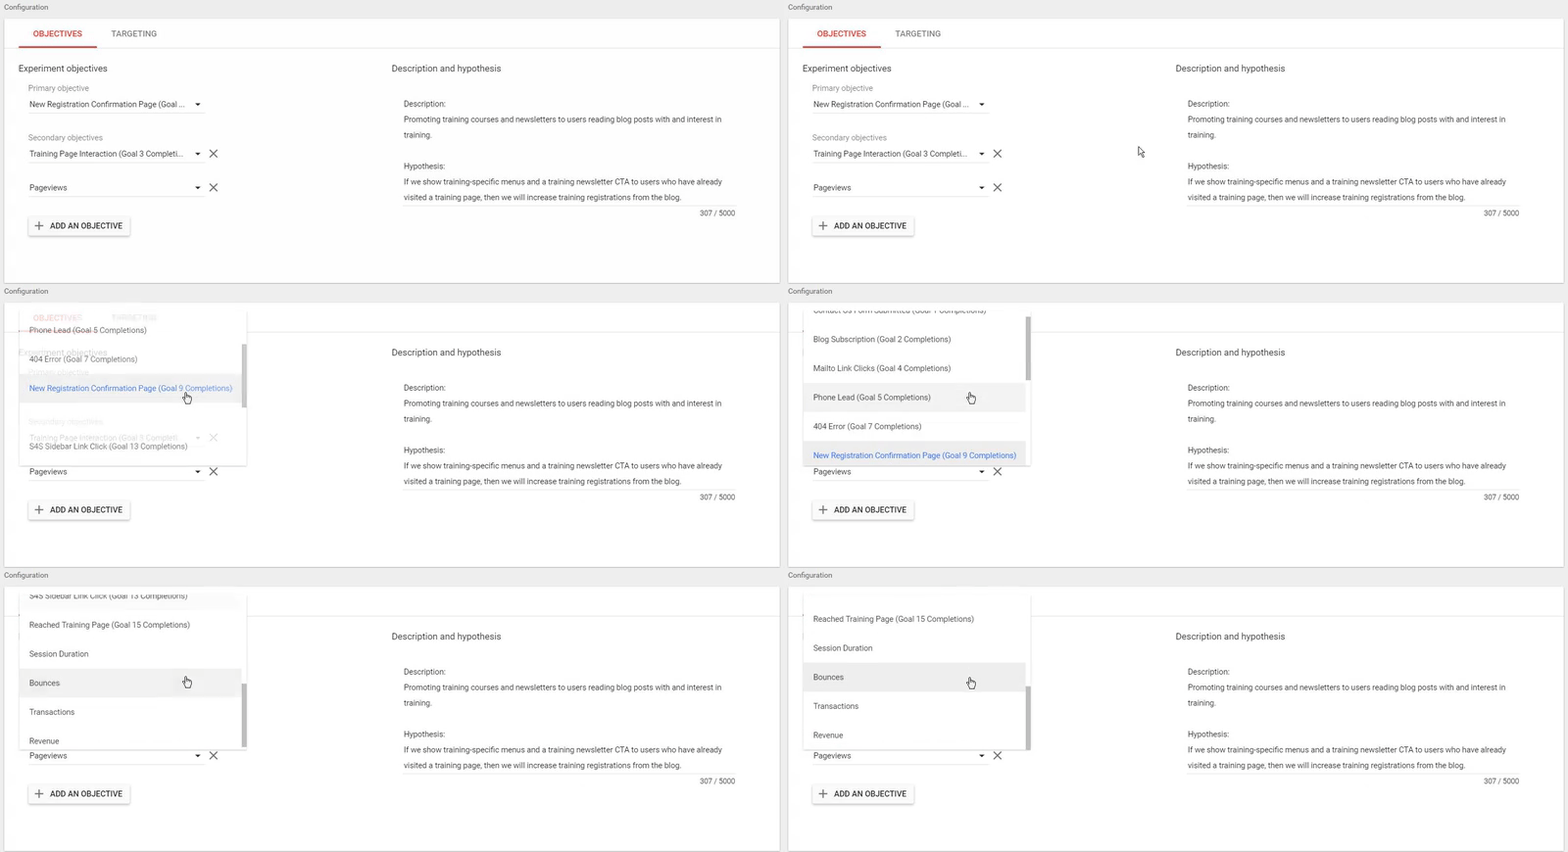
The configuration section is where you are able to provide a description of the experiment, select experiment goals (objectives), and select targeting parameters.
Selecting Objectives is Important. Unlike Optimize 360 (the premium version) you can not retroactively change objectives to see how your experiment affected other goals. So make sure you have all of your objectives selected before you start your experiment.
Hypothesis Best Practices. If you’re just getting started with testing, you may be tempted to simply write a description of test and skip the hypothesis. This is not recommended. Writing a clear hypothesis will keep you honest when the results roll in. Follow this basic formula when generating a hypothesis: If [I do this], then [this will happen].
Targeting
The targeting section is where you will define what conditions will fire the experiment. Targeting options are evaluated on page load.
Targeting Options. Each targeting option links to the Optimize targeting docs which have much more information about how to use each of these options.
- URLs. Target specific pages and sets of pages. URL targeting allows you to pick the web pages where your experiments run. URL targeting is useful for presenting experiment variants on a specific set of pages, easily defined by their URL. You can target a single page, a narrow subset of pages, or even Hosts and Paths.
- Audiences (360 only). Target Audiences that you create in Google Analytics. Optimize 360 allows target your experiments to Analytics Audiences. This allows you to focus your experiment on a group of users who have exhibited specific behaviors on your site.
- Behavior. Target users arriving to your site from a specific channel or source. Behavior targeting allows you to target first time users and visitors coming from a specific referrer.
- Geo. Target visitors from a specific city, region, metro or country. Use Geo targeting to target users from a particular geographic area. For example, you might invite users from a specific city to attend an in-person event or to visit your retail location. While typing in the Values field, you’ll see suggestions from the AdWords Geographical Targeting API to help speed rule creation.
- Technology. Target users visiting from a specific browser, operating system or device. Optimize looks at the browser’s user agent string to identify which browser is being used, what version, and on which operating system. You can use these data as targeting criteria in Optimize.
- JavaScript Variable. Target pages based upon JavaScript variable values. Use this type of targeting if you can find the value you’re looking for in the source code of the webpage in the form of a JavaScript variable.
- First-party cookie. Target the value of a first-party cookie in the visitor’s browser. Optimize can check to see if a visitor has a first-party cookie from your website and use that information in targeting rules.
- Custom JavaScript. Target pages based upon a value returned by custom JavaScript. Custom JavaScript targeting allows you to inject JavaScript onto a page, then target your experiments based on the value that the JavaScript returns.
- Query Parameter. Target specific pages and sets of pages. Optimize can check query parameters and use them in targeting rules.
- Data Layer Variable. Instead of referencing JavaScript variables in your targeting conditions, you can reference key-value pairs that are stored in the data layer.
Match Types
Each targeting option has a variety of different match types.
- Equals/Does Not Equal. Every character, from beginning to end, must be an exact match of the entered value for the condition to evaluate as true. Evaluate as true when the query parameter does not equal any of the entered values.
- Contains/Does Not Contain. The contains match type (also known as a “substring match”) allows you to target any occurrence of a substring with a longer string.
- Starts With/ Does Not Start With. The starts with match type matches identical characters starting from the beginning of the query string up to and including the last character in the string you specify.
- Ends With/Does Not End With. An exact match of the entered value with the end of the URL. You can target shopping cart pages that use /thankyou.html at the end of their URLs.
- REGEX Matches/Does Not REGEX Match. A regular expression uses special characters to enable wildcard and flexible matching. Regex matches are useful when the stem, trailing parameters, or both, can vary in the URLs for the same webpage. If a user could be coming from one of many subdomains, and your URLs use session identifiers, you could use a regular expression to define the constant element of your URL.
Free REGEX Book (PDF). If you’ve never used regular expressions, you’re missing out. They’re endlessly useful. LunaMetrics CEO Robbin Steif wrote a short book about using regular expressions for Google Analytics. It’s a great resource for those just starting out.
Editing Your Variation with Optimize Visual Editor
To use the Optimize Visual editor you will need Google Chrome the Google Chrome Optimize Extension.
Once you have downloaded the Optimize Extension, you can enter the visual editor by clicking on one of your variants. When the editor loads, you will see the editor page you defined when setting up the experiment. If you’ve ever used a WYSIWYG editor, this interface will be fairly intuitive. Point and click to select an element, drag and drop to move elements around, and use the blue slide up menu to modify an elements style. Below I provide details about the options available in this editor.
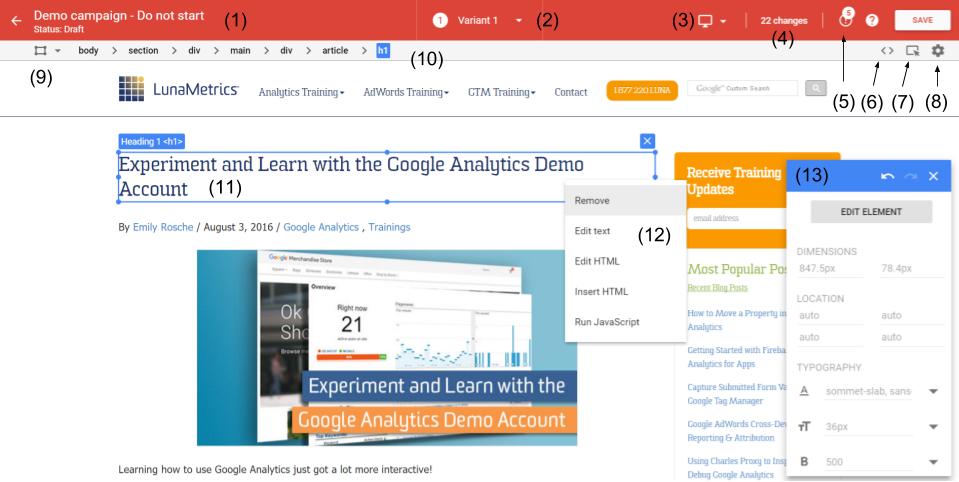
- Experiment Name. This is the name of your experiment.
- Toggle Variants. Displays a dropdown of variants, selecting one will load the variant into the editor.
- Device Testing. This dropdown menu displays stock devices to choose from. Selecting one of the devices will show you how your experiment will look on that device. Desktop is always selected by default.
- Number of Changes Made. Clicking on this element will open a menu that shows every change that was made to the current variant, and gives you options for editing or deleting each change.
- Diagnostics. This is a count of potential issues with the changes you made. These issues are also flagged in your list of changes.
- Custom CSS. If you prefer to working with code, this menu item will allow you to add custom CSS to variant. This is only applied to the variant you’re currently working on, not all variants.
- Interactive Mode. If you need to edit content that is hidden by a dropdown or tab, you will need to use interactive mode. Entering interactive mode will allow you click on elements to expose hidden content. You can then exit interactive mode to edit said content.
- Settings. There are two ways to drag and drop elements. The default is Reorder. Using the Reorder option
- CSS Element Selector. If you know how to use CSS selectors, you can use this feature drill into the DOM. This is the easiest way to do things like modify every <p> element on a page. One of our Analytics Engineers, Kristen Perko, talks about CSS selectors in her article about hover tracking.
- Element Hierarchy. This menu shows you how a selected element is nested in other HTML elements. You can use this menu to
- Selected Element. When selecting an element, it will be framed in blue. Once selected the blue tab at the top left of the frame will show you what element has been selected, and the element hierarchy bar will change to show you how that element is nested in the HTML. If you are having trouble selecting an element, get close enough with point and click, then use the element hierarchy navigation to traverse the page HTML. If you would like to select multiple elements of the same type, then use the CSS Element selector (#9).
- Modify Element Options. This dropdown is presented to you when you right click on the element you selected. The naming convention makes the options self-explanatory.
- CSS Editor. If you are not familiar with CSS, Optimize has an editor palette that makes changing styles simple. Just click, or use use the element hierarchy, to select the element you want to change. The CSS palette will populate with all of the styles of that element. Once selected you will be able to change the dimensions, location, font, text size, color, etc. or said element. Clicking on “Edit Element” will give you the same modifications options as right clicking on an element – remove, edit text, edit html, insert html, and run JavaScript.
Running Your Experiment
Once you have made your modifications, click “Save” and navigate back to experiment page. Double check your objectives and targeting options, the you’re ready to start your experiment.

Reporting
It is recommended that you let an experiment run for at least two weeks before looking at results.
As your experiment runs, the first card of your reporting tab will populate with the current winner. Once enough data is collected, Google will declare a clear winner.
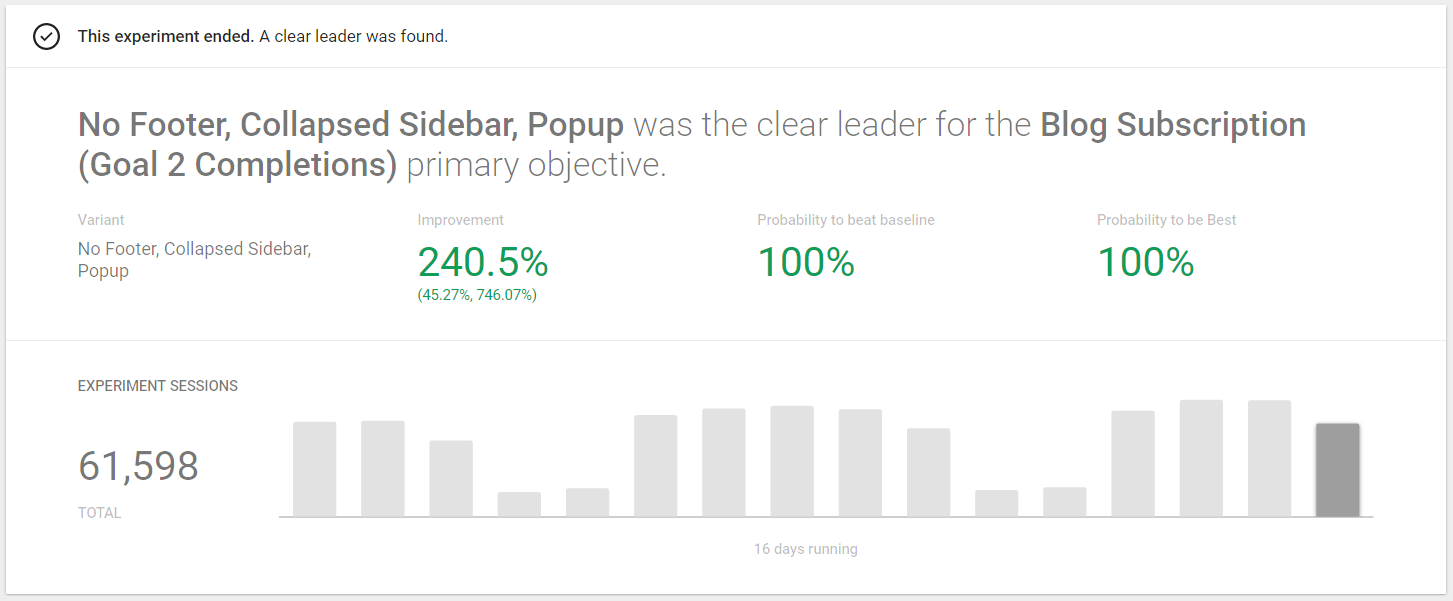
The second card on the reporting tab shows how each variation performed for each objective that you set.

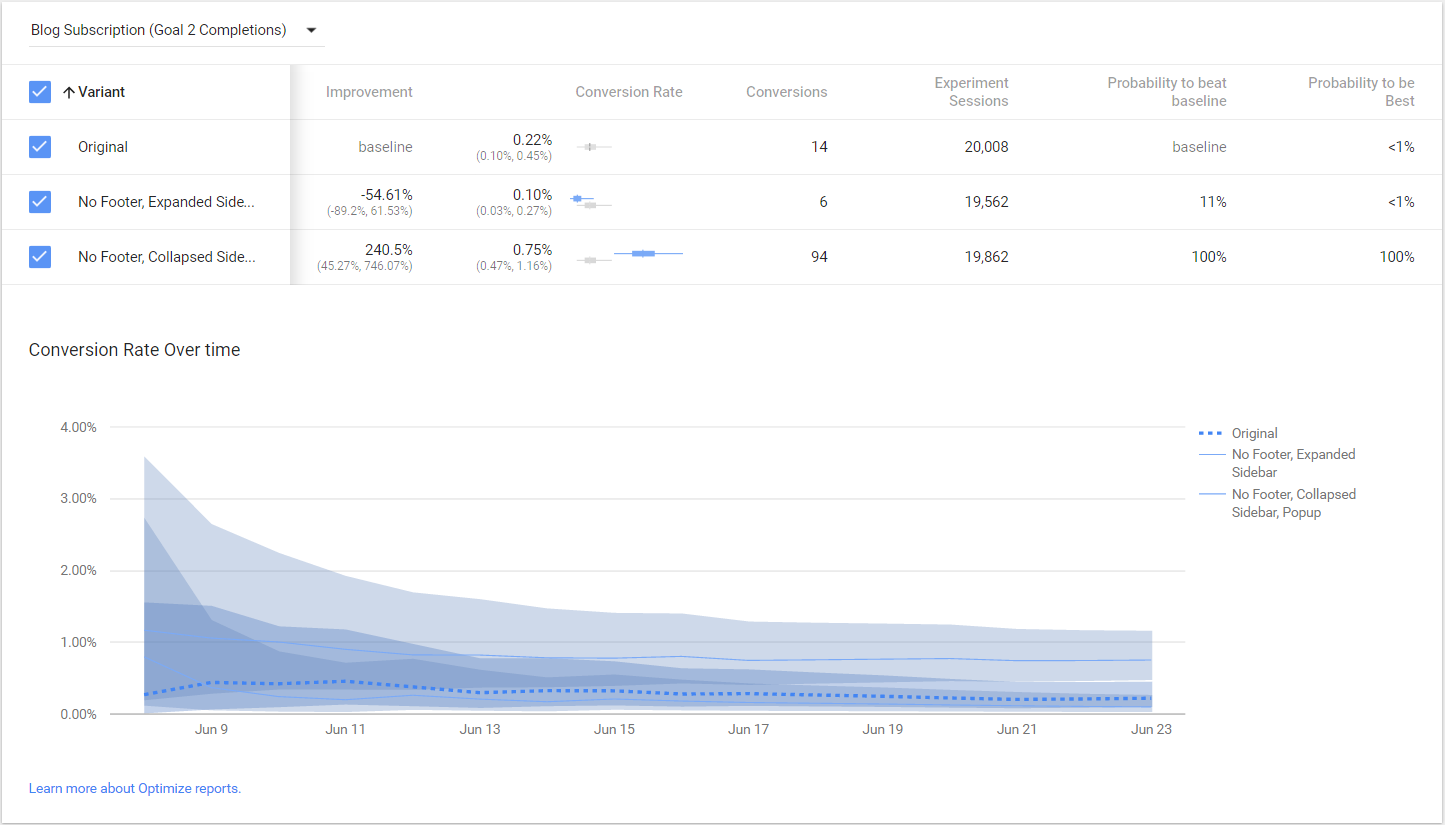
The third and final card in your report will show you more granular data about each objective, as well as a nice performance graph.
- Improvement – For a given objective, the difference in conversion rate, measured as a percentage, between the variant and the baseline.
- Experiment Sessions – An experiment session is the period of time a user is active on your experiment. By default, if a user is inactive for 30 minutes or more, any future activity is attributed to a new session. Users who leave your site and return within 30 minutes are counted as part of the original session.
- Probability to beat baseline – The probability that a given variant will result in a conversion rate better than the original’s conversion rate. Note that with an original and one variant, the variant’s Probability to Beat Baseline starts at 50 percent (which is just chance).
- Probability to be best – The probability that a given variant performs better than all of the other variants. Because there can be only one “best,” the sum of all percentages in this column should equal 100 percent.
What’s Next?
So, you set up a test and you ran it. Now what? Iterate. The success or failure of your experiment has taught you something that you can use to run additional experiments. Think about different forms of testing, or different targeting options. Remember that who you test is just as, if not more, important than what you test. So note what you learned, note what questions came from your experiment, and begin thinking about what your next test would look like if you changed the offer or changed the people who saw the offer. Repeat.


