How Big Is Your Metric Share In Google Analytics?

You get the big picture from your top-level metrics or KPIs, but to find action items you need to look more closely. Focus on one contributor to a top-level metric like sessions. For example, you could look at mobile sessions instead of all sessions. How’s your new responsive site doing? Specifically, what is mobile’s metric share?
Looking at mobile’s share of all sessions gives you a better idea how things are going. You may see more mobile sessions every month, but maybe all sessions are increasing. Is mobile’s metric share also increasing?
Mobile sessions are only one example, of course. You can get insight from other metric shares like these:
- Organic search traffic’s share of all sessions
- Paid search branded campaigns’ share of all sessions
- Your new landing page’s share of all sessions
- Any important page’s share of all pageviews
- A product category’s share of all revenue
Now how do you get this data out of Google Analytics? It’s easy to find the numbers you need, but they’re almost never pre-calculated for you. If you’re not looking for metric shares like % Sessions from New Visitors, or % Sessions with Site Search, then you need to do a little more work.
Follow our step-by-step guide below to find and calculate the metric share you want!
Step 1. What’s in the denominator?
A share is always going to be a ratio – some number (numerator) divided by some other number (denominator). Let’s say mobile’s metric share is 35%. So 35 out of every 100 sessions are mobile.
In the mobile sessions example, the denominator is the number of all sessions. By comparison, if I want product category X’s share of all revenue, then the denominator would be the total revenue for all product categories.
Simply put, you want to figure “a share of” some total. That total is the denominator.
For each step, we’re going to use the 12-month trend for 2016, with total sessions in our denominator for each month.

If you’re following along in your own data, the graph above is from the GA Audience : Mobile : Overview report.
Step 2. What’s in the numerator?
The numerator is one part’s contribution to the total. In the mobile sessions example, the numerator is the number of mobile sessions. We’re going to divide the number of mobile sessions by the total number of sessions to get mobile’s share.
So next we have to know how many mobile sessions we had each month. In Google Analytics, we can add these numbers to our graph from Step 1! Here’s how:
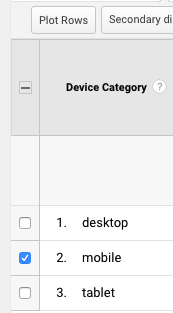
In the GA Audience : Mobile : Overview report, check the box next to the row with the value “mobile” and then click the “Plot Rows” button.

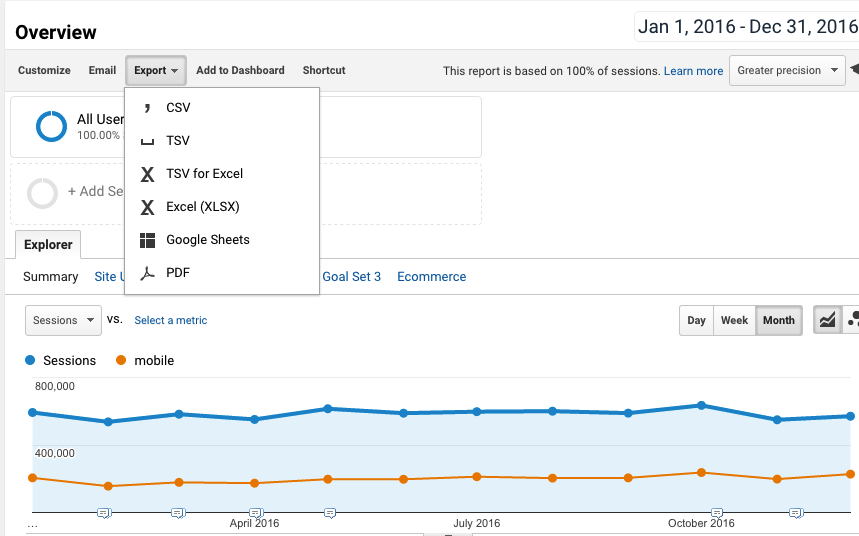
The result is a graph that shows both sets of data – all sessions in blue, and mobile sessions in orange.
Step 3. Export to Excel and Calculate
You have all the numbers you need on the graph, and Google Analytics lets you export the graphed numbers to Excel! It also gives you the numbers in the report table, but we don’t need them for this calculation.
At the top of the GA Audience : Mobile : Overview report, choose Excel from the Export menu as shown.

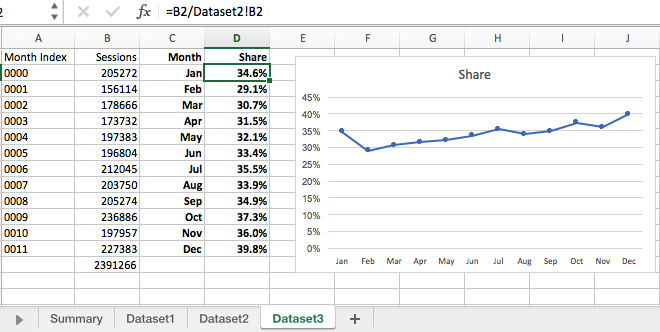
Open the Excel file and go to the tab named “Dataset 3” – this tab has the “month index” and the number of mobile sessions, i.e. your numerator for each month. Then add two more columns, one for month names, and one to calculate the share (shown in bold).

The formula for the first month’s metric share is B2/Dataset2!B2 which I’ve entered in cell D2 of the tab named “Dataset 3”. You can copy the formula all the way down column D to get the share for each month.
Select your month and share data and insert a simple line chart – now you can see how mobile’s metric share trended month to month in 2016. In this example it rose from 35% of all sessions in January to 40% of all sessions in December.
Make Data More Informative with Metric Share
Amp up your reporting – add data for metric share! Then find out how that share is trending, week to week, month to month, or year over year.
As with any analysis, you’ll get better answers when you ask specific, targeted questions. Context is important, too! So when you find large changes in a small time frame, re-examine the trend over a longer period of time.
And don’t forget basic math when doing month-over-month comparisons: Different months have different numbers of days!
Finally, make sure to be clear when you communicate your results. Use appropriate phrasing, like:
“Mobile sessions are up 50%, but that could reflect overall traffic patterns. We looked closer and found that mobile’s share of all sessions increased from 35% to 40% in the past year. This tells us mobile is increasing faster than desktop traffic.”
What contributed to last year’s trend for your important KPIs? Find out with metric share.


