Advanced Questions Publishers Should Be Asking In Google Analytics
If you are a publisher, using Google Analytics, but only relying on Pageviews and Sessions metrics, with all due respect, you are doing it wrong. Or rather, you’re not getting the full benefit of your investment in analytics.
This post is developed to inspire you to dig in your data, slice and dice it in a structured way, and look for opportunities where you can advance your KPIs and grow your business. Regardless of what KPIs you are focused on, whether it is increasing ad revenue, increasing engagement, creating awareness, bringing in new subscribers, etc, you should be always using the data you collected in GA to enhance your understanding of your audience, produce the most valuable content, and share it with your users at the right time (and potentially at the right place).
Some of the following questions would help you make quick decisions about content, users, events, and sources. There will also be some advanced questions that could be better addressed outside the GA interface, through a “data science project” via BigQuery. Hopefully we spark some advanced reporting ideas, inspire you about adopting more personalized content recommendation techniques, and discuss the importance and relevance of a few new analytics tools, namely Google BigQuery, Data Studio, and Optimize.
Also, before you begin answering the questions in this post, think about what your reaction would be to the findings; ask yourself how the results could benefit different teams in your organization – whether it be technical aspects, creative insights, or content/authorship related subjects.
Custom Dimensions and Content Groupings
Publishers have a trove of information outside of Google Analytics that when married with online performance and behavioral data can help enhance their reporting and understanding of how the content or the audience performs. We can use two different features in GA to bring in this external information: Custom Dimensions and Content Groupings. Hopefully you’re familiar with these features, or else we have a great post about the differences between the two.
At the very minimum, I would recommend having the following dimensions defined in your Google Analytics account:
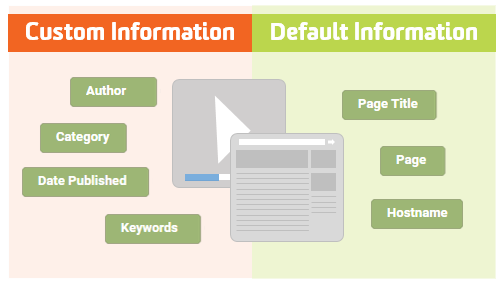
Content related dimensions:
- Category: Arts, Science, Business, Tech, Politics, etc
- Section: Google Analytics
- Author (or Reporter): Zee Drakhshandeh
- Content ID: 987654321
- Keywords: Publishers Advanced Reporting Google Analytics and Tag Manager
- Date Published (or Modified): 20170301
- Time Published: 21:30 EST
- Locality: “National” or “Local News #New York”
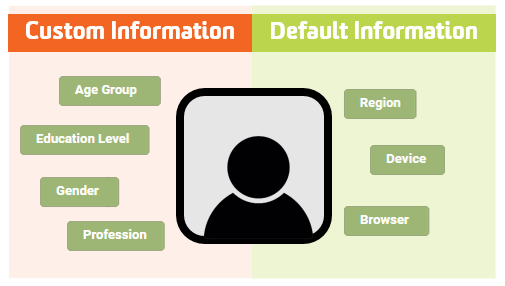
User related dimensions:
- Age Group
- Profession
- Education Level
- Gender
- Location
Be creative and come up with dozens of other content/user oriented dimensions. This is especially relevant if you are a Google Analytics 360 customer and you have the ability to allocate 200 different dimensions.
To populate values in these custom dimensions you can use Google Tag Manager or use the Data Import feature of Google Analytics. Through GTM, You can pull what you need off the page from the Meta tags, or get them from the values in the dataLayer. You can then set these values as custom dimensions or content groupings.
Content
Let’s start by looking at some reports around the content you are producing.
Here are some high-level ideas for reporting on content – the idea is to figure out if the content is engaging enough, and where we could improve. To answer these you can create custom reports and segments or analyze the data in Google BigQuery. BigQuery is the best tool for analyzing the customer journey.
1. Which categories drive the most traffic? To answer this, create a report to show the number of sessions by the Category custom dimension or Content Groups.
2. Article Views by Author: Who are the best performing authors? Which authors write the articles that get the least pageviews? Also, find out in which categories those authors are showing their best performance. To see this, pull a report for Pageviews by Author per Category/Content Groups. Furthermore, look at Acquisition per Author and measure the SEO effectiveness.
3. How many days does it take for a “hot” article to cool off?
4. What is the worst performing type of content on the site? What content is least engaging for your users? What can you do to help prevent them from leaving prematurely?
These reports would eventually help you with optimizing your Content Recommendation Engine based on the feedback you are receiving from GA. You want to make sure recommended contents are relevant to the user, based on what you know about them.
5. How much content do users view in one session, on average?
6. Do people who navigate through the recommended content tend to stay longer on the site, because they found the recommendations relevant and useful?
7. Which great articles are being dismissed when it comes to Organic search? Navigate to the All Page reports, apply the Organic Traffic Segment, and look for pages that have high pageviews but low entrances; these may be the pages that aren’t ranking well organically, but could be better optimized (SEO opportunity).
8. For bloggers, what is the best time of day to publish new content? Which day of the week is best? Are users more active on your site during certain times of the day vs others? Do these times differ based on what day of the week it is? For more guidance visit this blog on creating custom reports.
9. What is the impact of promoted content on overall user experience? What is the readership of the promoted content? Do users who consume the promoted content tend to interact with more content during the same session, or they find them irrelevant and exit the site? Is the promoted content a good representation of the quality of all contents? To answer these questions, you can create a segment of all users who interacted with the promoted content, and figure out how different their experience is, within a session, compared to all other users.
10. Context Switching: Do users navigate through different categories in a session e.g. going from tech news to sports to arts etc, or do they stay within one content group?
11. Which navigation features need to be developed or improved to help with finding new relevant content?
12. Do the length of the articles users are most engaged with have to do with the device type used to view them? Do users tend to read shorter articles on their phones? What about longer or more “analytical” pieces? Are those mostly read on desktops or tablets?
13. Comments: What content categories are the most promising when it comes to leaving personal/social comments? E.g. an editorial piece vs an analytical study vs a matter of fact report. How would you encourage discussions across the site? On average, how many comments does each article get? Also, analyze how users are interacting with each other; how many direct replies does a user receive after leaving a comment?
14. Cross Content Activity: In what percentage of sessions did users view different types of content? E.g. going from videos to articles to image galleries, etc.
Answering these questions will enable you to provide a more personalized experience to your audience and keep them more engaged on the site.
Engagement Events
Now let’s discuss user engagement. Assuming you are tracking a variety of events through Google Tag Manager such as Navigation Menu clicks, Promotion clicks, Carousel (slider) clicks, Lazy Load events, clicks on Recommended Content, video interactions, scroll interactions, time spent engaging with the content (as opposed to the built-in Time on Page metric), etc, you should be able to pull detailed reports around user engagement. Google Analytics 360 would enable you slice and dice the event data to some extent, but using BigQuery for data analysis is highly recommended.
Here are some high-level questions to get the gears turning:
15. Which block of real estate is extremely valuable on the top level pages?
16. How does the position of a promoted/recommended content play a role in keeping the users engaged? Does promoting content on the side of the page work better than the bottom or the top?
Video Events
Here are some high-level ideas for reporting on how video engagement looks throughout the site – must have Video Tracking in place:

Sample Video Engagement Dashboard in Google Data Studio
17. What percentage of sessions included video interactions? What percentage of users watched videos? How many “video plays” were there vs. “videos watched to the end” (90% of the length or so)? What is the drop-off rate?
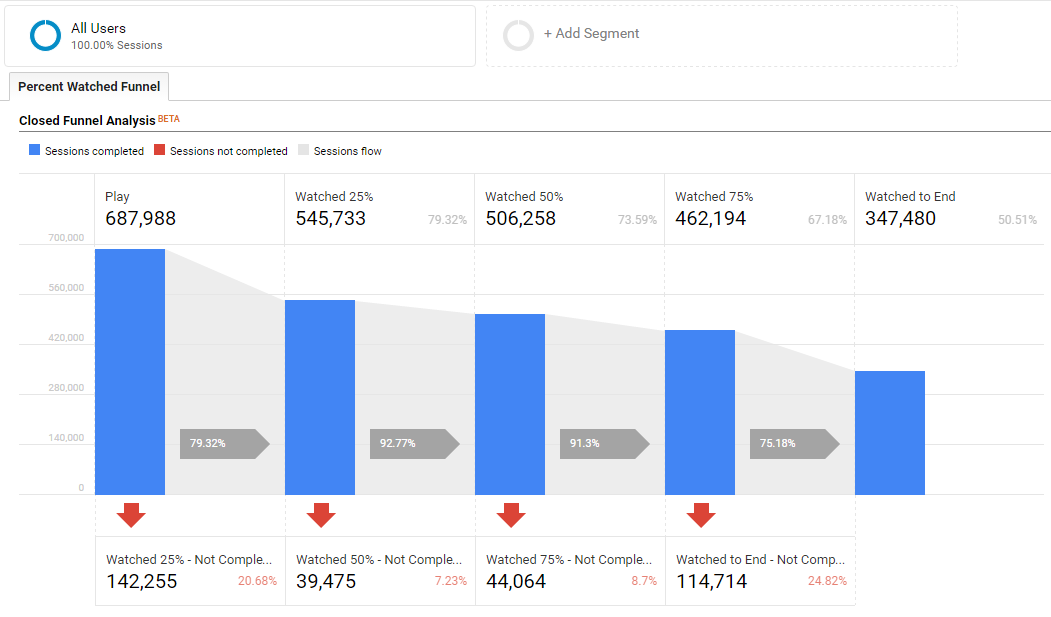
Percent Video Watched Custom Funnel in Google Analytics 360. Try applying different segments to see what you get.
18. How does the engagement look across different devices?
19. Which user cohort (think locations, demographics, etc) is highly interested in videos? On average, how many more minutes do the “video consumers” spend watching videos compared to the other cohorts (e.g. “News Readers”)?
20. What percentage of users are highly engaged with videos, aka “video consumers”?
21. Which video category is the most engaging; e.g. sports vs tech or interviews vs reporting vs analytical pieces? What are the hottest video topics and stories? Also, break down the reports looking at different user groups.
Scroll Tracking Events
If you are using our Scroll Tracking recipe, you should be able to create the following reports in the GA interface, Data Studio, or BigQuery.
22. How far down the page do people scroll? What does the breakdown look for different categories? You could also create a Custom Funnel in GA 360 to visualize the results, and have a separate tab for each category.
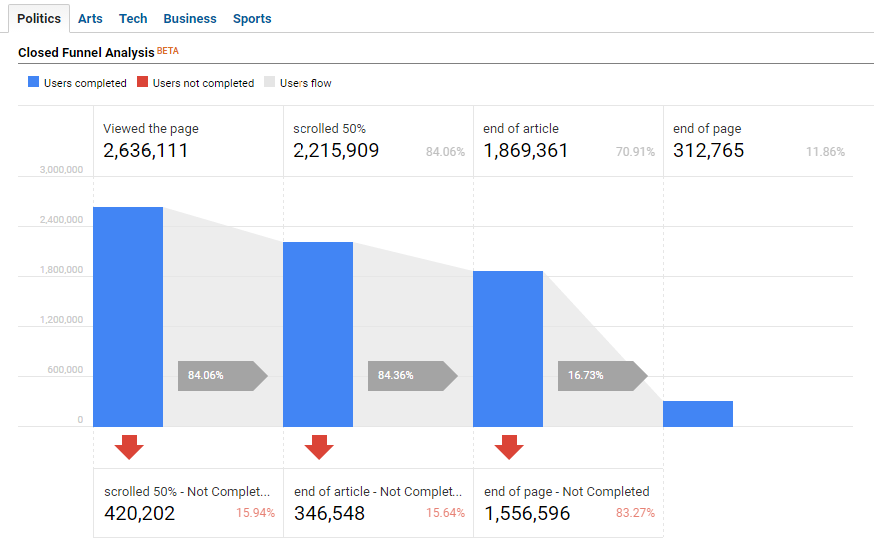
Scroll Tracking Custom Funnel in Google Analytics 360
23. How long do people stay on different pages? The answer is pretty straight-forward if you are using our Engagement Timer recipe; you would need to breakdown the overall time per category; e.g. try to figure out if users are staying longer on the entertainment section.

Engagement Timer Funnel in Data Studio
24. Who are the most engaging authors or content producers? Create the Article Engagement by Author report, to look at the highest active time on page values (using the results of the Engagement Timer) in conjunction with scroll depth results.
25. Using the Engagement Timer, you can also create two Reader Cohorts, i.e. Skimmers and Readers, and analyze their behavior differently. Could you figure out which group is consuming the most content, and which group stays on the site longer?
Audiences
We analyzed the audiences quite a bit so far within other reports. Now let’s examine the individuals more closely, with the hopes that it helps you personalizing the content and features.
26. How often do users return to your site? Look at Frequency & Recency reports. Also compare the trends between New Users and Returning Users.
27. What devices do your users use to visit your site, and are they working? Is your site optimized to support those devices? Is mobile traffic increasing? Are mobile visitors more or less engaged? You can apply the Mobile Segment in your Production View, or create a Mobile Only View to better analyze mobile traffic.
28. Ad-block Usage: What percentage of non-paying users are using ad-blocks? How much ad revenue are you loosing for those sessions? Do you need to start thinking about enforcing ad-block rules? Or are there better models for monetizing the site? You might want to focus on personalization and producing better content to encourage non-paying ad-blocking users to subscribe.
29. Geo: Are you segmenting the content based on its locality? Are you segmenting the users based on their location?
30. Are your users mostly relying on you to provide them with up-to-date local news? Or have you observed some other patterns?
31. Do visitors from rural areas show different browsing habits compared to the urban traffic?
32. Income: When segmenting users based on their income, or any other of the custom dimensions you added, do you see different trends in the type of content consumed, average time on site, video/scroll engagement, “Readers vs Skimmers”, etc?
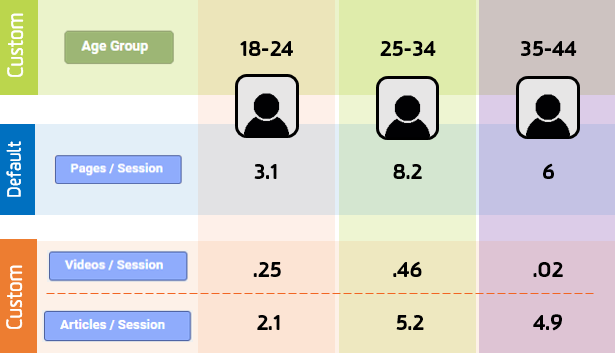
Use custom information about your users stored in Google Analytics to find insights about differences in behaviors.
33. Education and Professions: How does the education level impact all other dimensions described so far? What about different professions?
34. Top Commenters: Who are they and what do you know about them? What are they interested in?
35. If the intended demographics for particular content is provided by the author/content producer in the Meta data, you could take advantage of it to feed your recommendation engine with more granular data to come up with the most relevant content recommendations (personalization).
Logged-in Users
If you have implemented Login Tracking and are capturing User IDs in Google Analytics, you can benefit from using a “Logged-in” segment or a “User ID” view to analyze the behavioral patterns in segregation. Studying the subscribers pattern will help you come up with ideas for enhancing your “new subscribers” conversion funnel.
36a. Do subscribers visit the site more often? What about their content consumption patterns
36b. Do they read/watch fewer or more content?
36c. How engaged are the logged-in users?
36d. How many devices are used by logged-in users?
36e. How is Device Switching happening throughout the day? Do the users access the site on their desktops during the days and mobiles/tablets during the evenings? Would you prefer recommending longer or shorter content with regards to the device currently in use? Maybe offering different versions of the same article?
You can also plan on evaluating some of your hypotheses via A/B testing through Google Optimize.
Sources
Last but not least, let’s look at the Sources of traffic, how effective they are, and if they are impacting the browsing habits:
37. Authors: Measure how much new organic traffic each author is generating.
38. What is the Bounce Rates on the Landing Pages?
39. What is the number of articles read in a session per Source of the traffic? Try to figure out which Source is driving the most engaged users.
40. Social Trust: How often are “returning users” coming back through social channels?
41. Which categories drive the most “social traffic”? Which categories are best performing/highly engaging on social media? E.g. Compare the performance of different categories bringing in new traffic from Facebook vs LinkedIn vs Twitter.
42. Do you see spikes in metrics for timely content on heavy news days? If not, probably your users are getting their news elsewhere.
Conclusions
Publishers are putting in so much effort creating online content. Most publishers also invest heavily in their analytics infrastructure. But not all publishers are making data-driven decisions as to what to produce and how to create a more personalized experience for their users. I hope this blog inspired you to take another look at the piles of data you are collecting everyday in Google Analytics, understand what your visitors are there for, and come up with new hypotheses and tests to improve your online services to create the best experience possible.
By analyzing the content, events, audiences, and sources, you can provide quality content to the right consumers. By studying different user cohorts and analyzing the visitors’ past viewing habits and attributes, you could gain substantial insight into how to enhance your recommendation engine and how to dynamically change the experience for your users.


