Tracking Multiple Checkout Funnels In Google Analytics
Tracking how your customers move through your site, and specifically, your Checkout process is essential to understanding “normal” user behavior and spot challenges that may impact conversions.
Enhanced Ecommerce is a great feature in Google Analytics that lets you track a number of things, like add to cart, product impressions, promotions, and more that aren’t available with the default Google Analytics implementations. One of these additional features is Checkout Steps, which lets you see how people make it through the final conversion funnel and see where the drop-off is happening.
The Checkout Behavior report is found under Conversions -> Ecommerce -> Checkout Behavior and displays how many people fell out of the checkout process at each step and even create segments/audiences of users at each dropoff point.
Here is an example of what we could have for most ecommerce sites:
- Confirm Cart
- Add shipping info
- Add billing info
- Review cart
- Complete purchase

This looks like a pretty standard funnel, so what can go wrong?
Multiple Paths To Take
Things get a little tricky when your checkout steps can change. This could happen with different users, different industries, or even the products that users choose to purchase.
In our example above, we have a shipping option. However, if someone is signing up for an online subscription, there wouldn’t be any shipping information to enter.
To show an example of how steps could be different based on products, let’s say you sell magazines because I am sure we can all remember getting those subscriptions! The difference is that most of this content lives online now. As far as your site is concerned, let’s say that people can either purchase the physical magazines and have them shipped to their house, or people can pay for the online access as a monthly subscription.
So how do we send all of this information to Google Analytics, and still keep it organized and relative to the checkout funnel that they user went through?
Tip #1: Keep The Steps Consistent
First, you will want to map out each step and find a way to keep the number of the steps consistent, no matter the funnel. For example, step 2 will be for shipping information, even though digital subscribers will skip from step 1 to 3. Make sure that the Billing Step always occurs at the same point.
Tip #2: Choose and Communicate
If there are steps that can be skipped, you have a few options. Consider all and communicate how that will appear in your reports.
Skip the Step, Mind the Gap
If in our example above, there is a shipping step that only some people see, then you’ll notice an odd dip in the Checkout Behavior Funnel. And then for the following step, you’ll see a larger group that show up in the top slice, essentially telling us users that entered the funnel at this step. Google Analytics will see that that user did not have a checkout action where the step was set to 2, so it will separate out these users.
This could be fine! Just be aware that it will occur, and be prepared to talk about it.
Fake It Till You Make It
The other option might be more technically challenging but will likely provide a better experience. Again using our example from above, it a user could go directly from Step 1 to Step 3, the fix here is to fire TWO hits to GA when that user arrives on Step 3. We would fire a first hit with Ecommerce information that says the user DID hit Step 2. Then we’d fire another saying that the user hit Step 3.
This keeps the funnel flowing in the direction we expect. Online purchasers passed through Step 2, so they still get counted. You can enhance this method using the Checkout Options, which is coming up next.
Tip #3: Use All Your Options
There’s a great option here to help make it clear just what is happening on that Shipping Page called Checkout Options. These are extra pieces of data that you can pass in, that show up in the gray arrow connecting the steps together.
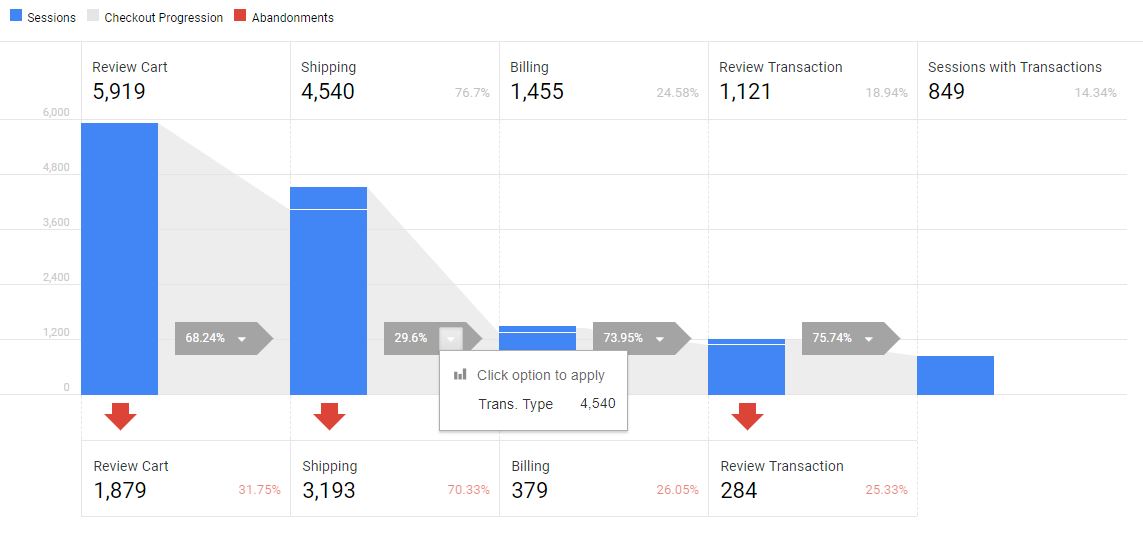
Checkout options are commonly used for comparing shoppers and checkout funnels by things like payment method (Visa / Amex / Master Card) or by shipping method (standard / expedited / 2-day air). If you aren’t using options on this particular step, you can use it to distinguish the funnel that a user is in. In this case, on the Shipping Step, we would add where the customer was an online or physical purchaser.
I will not get too technical with the implementation because there are many great resources out there, but this Bounteous blog can tell you more about that part, and I will show how you can use it in GA for your daily reporting.
Tip #4: Use Custom Dimensions
The Checkout Behavior Report can be segmented, which means we have enormous potential here.
If you are already setting the checkout option for other reporting needs, you may instead or in addition set a custom dimension with the particular type of purchaser, and set it to SESSION LEVEL within Google Analytics.
Changing the Data Table
We can use this info to update the data table below the funnel. Once you are in your Checkout Behavior report, scroll down to the data table. At the top left corner of the table, you will see a drop-down button to change the dimension for the table, which is normally set as “User Type” by default. You can change this dimension to the new checkout option or custom dimension that you set up.

Adding Segments
If you want to change the visual graph above, you can apply a segment to the whole report, which will also affect the data table at the bottom of the report. To apply a segment, scroll up to the top of the report and click “Add Segment,” then create a new segment based on your new Custom Dimension. If you go with the segment route to change the entire report, I recommend using a separate dimension on the data table.

For example, create a segment for people who were part of the Physical Purchase checkout flow, then change the dimension of the table to Device Category. Do we see more traffic for digital subscribers coming through on mobile devices, but physical subscriptions on desktops?
You can also look for differences in dropout rates at specific steps depending on the device that someone is using, which could shed some light on how user-friendly the site is for different devices.
There are many different ways that you can use the Checkout Behavior report to see how people are converting. Adding useful custom dimensions like Checkout Type can help you dig deeper into what users are experiencing on your site and help with future web development and marketing/re-marketing efforts.