Smarter Marketing Planning With Data‑Driven Attribution

Understand which marketing channels are contributing and at what point in a customer’s journey with Data-Driven Attribution in Google Analytics 360, a custom model built for you with all of your Google Analytics data. Discover channels with previously-hidden value, campaigns that are outperforming expectations, and new ideas for your message and positioning.
Data-Driven Attribution, coupled with a solid Google Analytics implementation, can help answer important questions about which channels are working and how they work together. Do your Google Ads campaigns perform better as openers in awareness campaigns, or should messaging and targeting be adapted to focus on closing the deal? Are you getting the return you expected for your investments in email, social, affiliates, remarketing? Let your data point the way to success.
What Makes Data-Driven Attribution Better
Google Analytics comes with several built-in attribution models to help you spread out the credit to the various touchpoints that helped contribute along the way. The different models each represent different ways of approaching the attribution problem and so there’s certainly no correct model. Each company may have different needs or incentives to use a specific model. Donovan helps break down the models in his post:
While these models can be tweaked and adjusted, it can be hard to know just how much weight to give different channels at different touchpoints. Enter Data-Driven Attribution.
Dynamic Modeling
Google Analytics 360 and Data-Driven Attribution uses a methodology based on cooperative game theory to assign different weights to the touchpoints on your customer’s conversion path. Compared to static models based on rules or positions, the algorithm behind Data-Driven Attribution produces a dynamic model custom-made for your business.
It Uses All Your Data
Take a look at your conversion rate on your website – depending on how you’ve set up your Goals or Ecommerce – it’s likely hovering somewhere around 2-10%. The default attribution models in Google Analytics use only converted paths to help determine the results, meaning you might only be using 2% of the data you’ve collected. Until someone hits that purchase button, they’re not included in your reporting.
Here’s where Data-Driven Attribution leaps ahead – the algorithm considers both converted and unconverted paths when calculating which touchpoints should get more credit. Analytics 360 will take as much data as you can give it!
You may have also seen data-driven attribution in Google AdWords, but it uses only AdWords data. Google Analytics 360 will use traffic from any source/medium to help create its model.
Automatic Updates
The data-driven model updates itself every week, so you can make decisions based on current information.
How to Make the Most of Data-Driven Attribution
Out of the box, you can see how Data-Driven Attribution is a customized solution that provides you with more detail than the static models. But to get the most value out of Data-Driven Attribution, or any attribution tool or model, take the extra steps listed below.
Link Google Products
Add campaign and cost data by linking Analytics 360 with Ads, DoubleClick, and the Google Display Network. You can even get impressions and view-throughs depending on which products you connect to Google Analytics.
Import Cost Data
Anywhere you spend money and track campaigns – for example, Facebook or Bing – should be included to help calculate your return on investment. Upload cost data with the Data Import feature in Analytics 360.
Campaign Tag Everything
Tag all campaign links, like the ones you send in email or post on social media, to go with that cost data. Cost data + campaign data + your custom model = a true budgeting tool!
Check Data Accuracy
The best models are built on clean data, so make sure you’ve taken steps to capture everything as accurately as possible. For example:
- Exclude internal traffic
- Eliminate duplicate transactions
- Verify Ecommerce revenue
- Define non-Ecommerce conversions clearly
Note that models can be built only if you meet certain minimums, detailed below. If you have a site with low conversions, consider defining a conversion based on an intermediate step that occurs more often.
Getting Started with Data-Driven Attribution
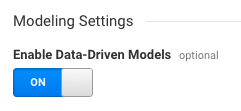
As an Analytics 360 customer, you have a special setting in every view to enable data-driven models. Toggle this setting on and click Save. Within 7 days, your first data-driven model will be ready.

Ensure Thresholds Are Met
Choose a view that has enough conversion data to build the model. You must have 400 or more conversions of at least one conversion type in the past 28 days, as well as 10,000 paths of any type (or about 10,000 users). Your conversion types may be Ecommerce, non-Ecommerce (analytics goals), or both.
Open the Model Explorer
Think about your current campaigns and what you expected to achieve. Go to the Model Explorer report, and select a conversion type.
Look for surprises: What channels show up in the upper funnel vs. the lower funnel? Did paid search play a bigger role in raising awareness than you thought it would? Do the weights change when you select a different conversion type? You might re-evaluate your message and targeting in light of unexpected findings.
You can also export the model to examine the weighted paths in more detail.

Compare Models and Zoom In
When you compare your custom data-driven model to one of the static models, opportunities may appear – such as the potential for increased return or reduced cost per acquisition.
Go to the Model Comparison Tool, select a conversion type, and select the data-driven model along with one other model (such as the Last-Interaction model or the Position-Based model).
Now zoom in to view specific campaigns or keywords – change the Primary Dimension and search using the table filter. Then use the metric selector to view CPA or ROAS, and sort by the % change.
What does the data-driven model reveal? Was the static model obscuring the value of your social media campaign? Look for a new hypothesis to test!
Tip: Use the advanced filter to view only rows that have significant conversion value, e.g. greater than $1000 (relative to your data, of course).

Check the ROI Analysis
Finally, check the ROI Analysis report. This report calculates return on investment, adds click and impression data, and focuses on one model at a time. As described above, you can zoom in to view specific campaigns or keywords – and look for opportunities.
In the ROI Analysis report you can immediately see the value of adding as much cost data as possible to Analytics 360!
Put Analytics 360 to Work for You
Data-Driven Attribution is a valuable tool for taking action based on data, and it’s available only to Analytics 360 customers. Your custom data-driven model leads you to ask the right question, form a good hypothesis, and test with a greater chance of success.
Want to learn more about Bounteous and Analytics 360? We’re happy to help!


