Data Studio Template: Comparing Multiple Google Analytics Sources

Any time you’re making a big change in the way you’re tracking data on your site, it’s helpful to first compare data from your old implementation to data collected from your new implementation. Maybe you’re about to begin a migration from GA Classic to GTM, or soon you’ll be employing a new ecommerce implementation? This usually means sending data from your new implementation to a property separate from your production property. You can then compare the data in the two properties to ensure that your new tracking is working as expected.
We’ve actually written about this method of migrating from an on-page implementation to a new one in GTM and about migrating complicated implementations if you want to check those posts out.
However, comparing data in two different properties isn’t very easy to do within the GA interface. Fortunately, there is a better way to compare data outside of Google Analytics: DATA STUDIO!
Data Studio Template
Template Configuration
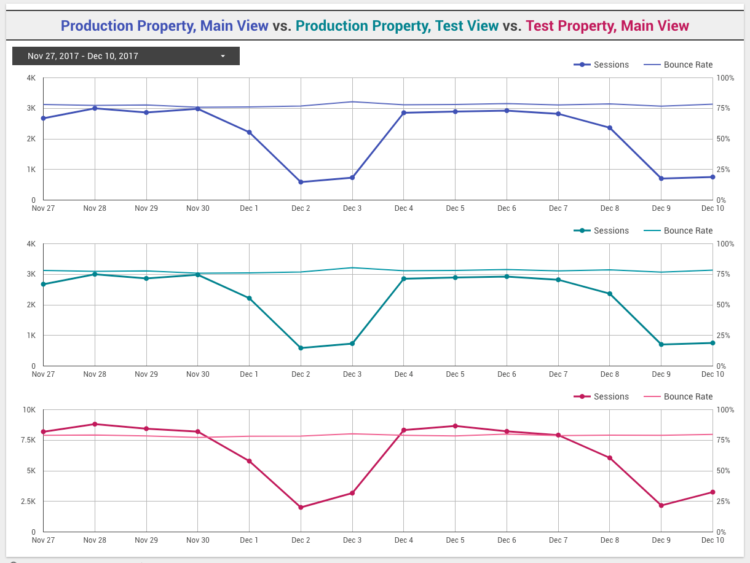
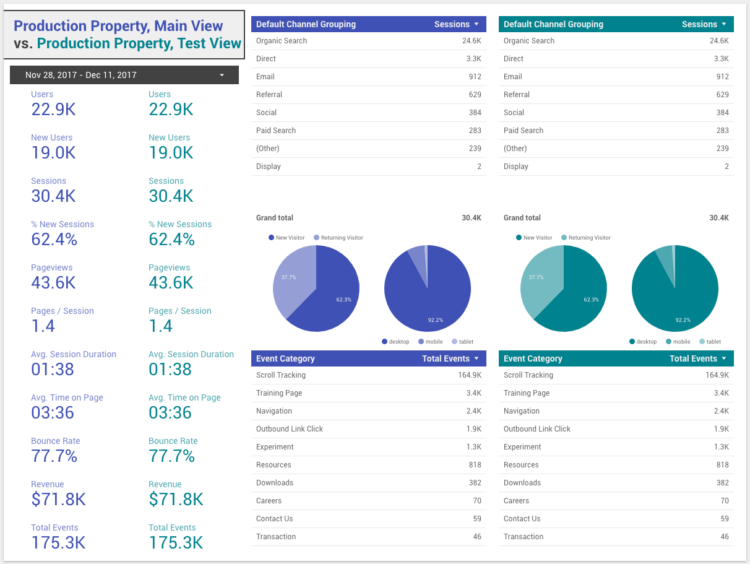
The template consists of four pages: one that compares session and bounce rate metrics for all three linked views and three that compare each combination of GA data sources.
I’ve included room for three possible data sources as placeholders:
- Production property, Main view
- Production property, Test view
- Test property, Main view
You may not need all of those data source combinations – for example, if your Production property test view configuration is identical to your production property main view configuration, you may not need that page of the report – but the combinations are there if you need them.
Link to Template and Steps
Steps to using this template:
Get Free Data Studio Template
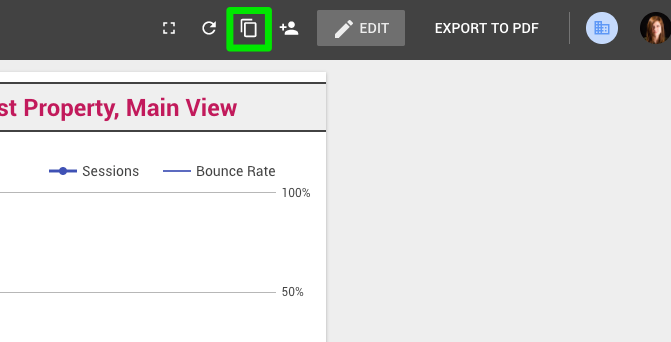
1. Make a copy of the template:
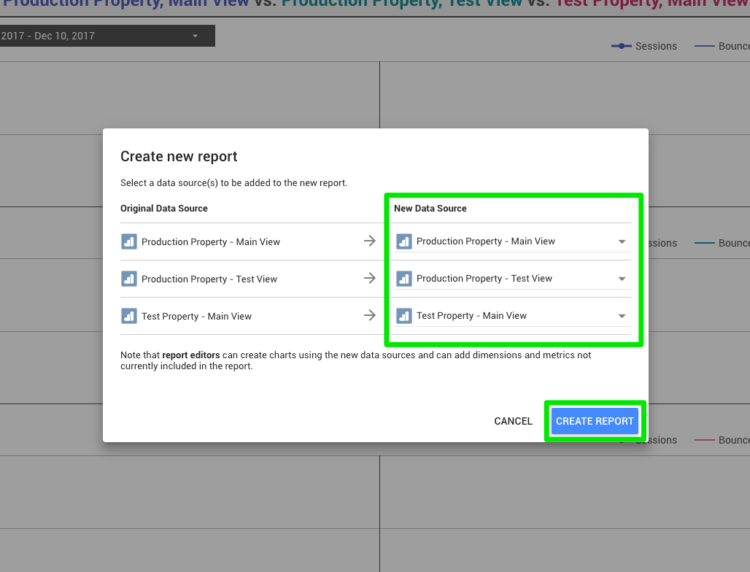
2. Link the new data sources to your own GA views:
And that’s it! The report should populate with data from your linked sources:
Adding More Data Comparison Sheets
You can add more data sources to this report in order to compare them as well.
1. Enter Edit mode:
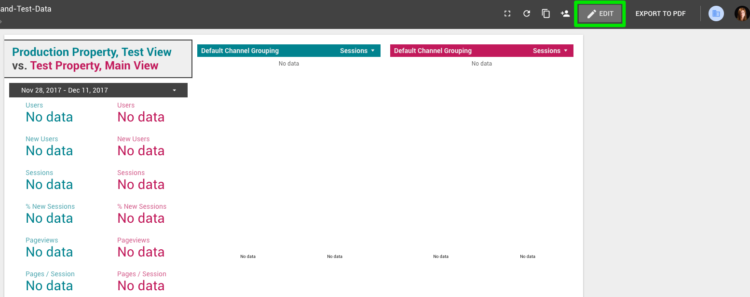
2. Make a copy of one of the comparison pages:
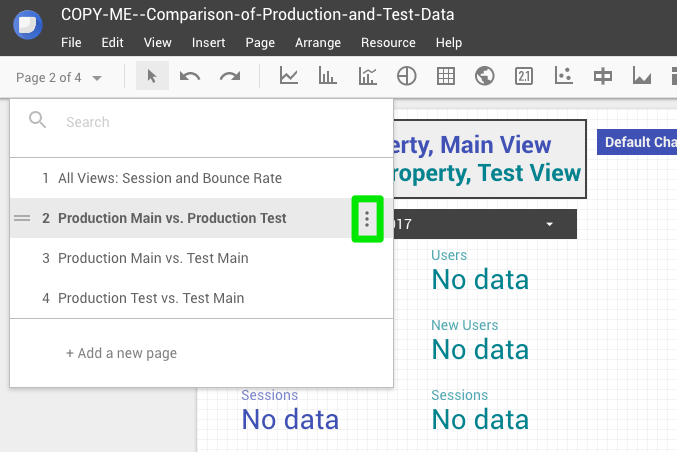
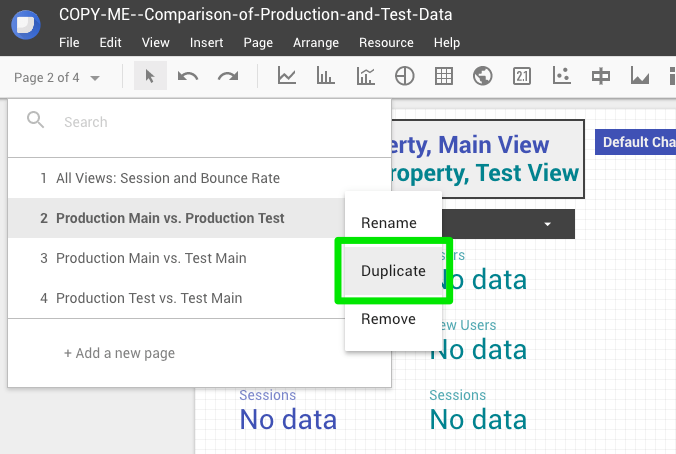
You can then click on each scorecard, table, or chart and change the data source to the view you want to pull data from:
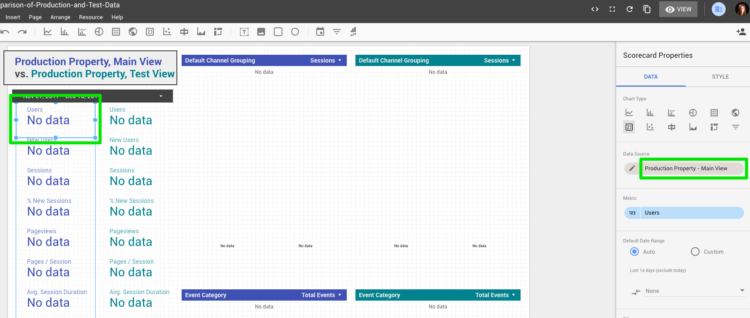
Select the new data source from your list of added sources or create a new one:
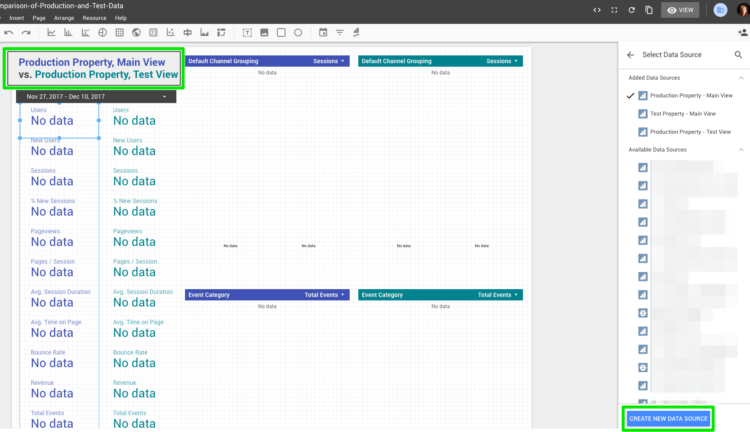
And don’t forget to change the title of the page and the color scheme of your new pages to ensure that the data contained in them is understandable to anyone who may look at your report.
Keep an eye out for more Data Studio templates from us! Comment below about what you would find useful for us to build!


