Google Analytics Monthly Overview Dashboard Recipe for Data Studio

With unlimited, free reports for everyone, it’s easy to start playing around with Data Studio and see if it meets your organization’s needs. To help with that, we’ve created a free report that you can use as a starting point for your organization. Use our Monthly Overview report to create an interactive report that you can share with colleagues, even if they don’t have access to your Google Analytics. Take our report, make a copy, and replace with your own data!
Instructions
1. Make a Copy
Go to the File menu and click to make a copy of the report. If you have never used Data Studio before, click to accept the terms and conditions, and then redo this step.
2. Do Not Request Access
Click “Maybe Later” when Data Studio warns you that data sources are not attached. If you click “Resolve” by mistake, do not click to request access – instead, click “Done”.
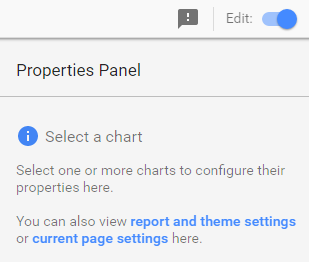
3. Switch Edit Toggle On
Make sure the “Edit” toggle is switched on (see screenshot). Click the text link to view the current page settings. The GA Demo Account data will appear as an “Unknown” data source there.
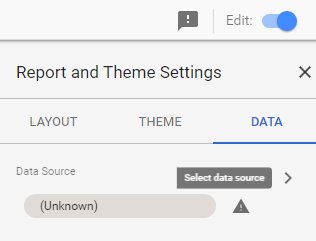
4. Select Data Source
To view the list of available data sources, click the tiny arrow that looks like an angle bracket in the screenshot below. This will open a pane from the right side of the page.
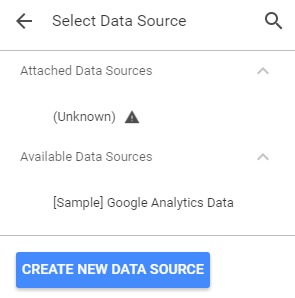
5. Create New Data Source
If you have not created any data sources yet, you’ll see only sample data under “Available Data Sources” – in that case, scroll down and click “Create New Data Source” to add your own GA data to the available list.
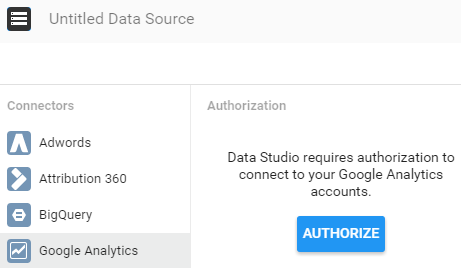
6. Select Your Google Analytics View
Choose the Google Analytics connector, and authorize access if you aren’t signed in to GA already. Then select your desired GA account, property, and view from each column.
7. Connect to Your GA Data
Name your data source (at the top left), or let it default to the name of the GA view. Click the blue “Connect” button at the top right.
8. Add Data Source to the Report
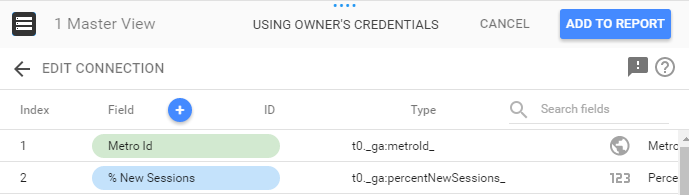
Next, Data Studio shows you a table of all the fields available in your data. You can rename them, change their type, and create new calculated fields – but for now, simply click “Add to Report”. And confirm.
Because you’re doing this step under Report Settings, you’ve just created the default data source for the entire report. You can change a data source on any page (or on any chart or filter!) – but if you don’t specify a change, then the default data source is used for every new element you add to the report.
9. Check Your Conversion Data
If necessary, tweak the definitions of conversions and conversion rate to correspond to a different goal number and name. In this report “conversion” refers to the Goal 1 completions and Goal 1 conversion rate in GA, but your primary conversion may be numbered as Goal 2 (or some other number) in the Google Analytics view you selected.
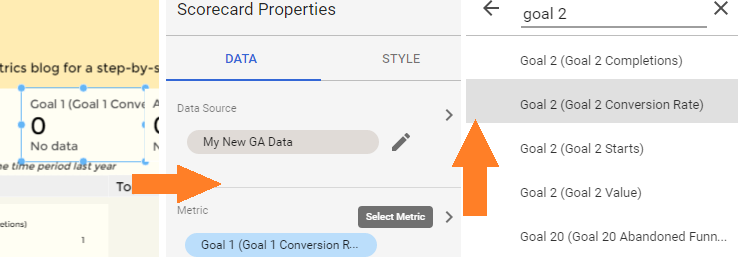
If it’s Goal #2 you need instead, then change Goal 1 to Goal 2 everywhere you see the word conversion in the demo report. Click on the element you want to revise, e.g. the Scorecard metric in the center of the top row (see screenshot). This will pull up the Scorecard Properties where you can make the change – click that tiny little arrow to “Select Metric”. Type “goal 2” in the search box, and then click to select “Goal 2 Conversion Rate”.
10. Customize for Your Organization
Here comes the fun part! Swap out the image in the top left with your own company’s logo. Delete the text that talks about our blog post. Update the colors to match your own internal branding, swap out graphs or change items. Add new pages or target specific reports to departments within your organization!
11. Report Filter Combos
Our demo report contains seven different filters which you can use alone, or mix and match. Select one or more options from each filter, and watch them update every chart and metric on the page.
Create your own filter combos! Here’s a few for inspiration:
- Paid search mobile traffic
Channel = Paid Search
Device = mobile - Users who visited at least twice in the same day
User Type = Returning
Days Since Last Session = 0 - Non-bounced users from outside your country
Session Duration is not 0 (un-check that option)
Country is not your country name (un-check that option)


