Validating Google Analytics Hits With The Network Tab
In our Google Analytics and Google Tag Manager training seminars, I often get the question “how do we know our tracking code is working?” There are a variety of tools you can use to test your implementation – we actually wrote about many of them in another blog post – Google Analytics and Google Tag Manager Debugging Tools. One we didn’t cover in that post is what we often refer to as the “source of truth” when it comes to identifying whether or not your Google Analytics tracking code is doing its job: your browser’s Network tab.
Why the Network tab? Well, we call it the “source of truth” for a reason – the Network tab is the only tool with 100% accuracy. It’s the only tool that shows you (1) the exact form of the request that was sent to Google, and (2) the exact response – which we will learn how to interpret in this post.
While other tools are certainly helpful to get a quick sense of what’s working and what’s not, it’s great to have options when it comes to testing an analytics implementation – and the Network tab is one of our go-to tools for feeling confident in our setup as it tells us EXACTLY what is being fired and when. It also provides some additional helpful features you won’t find elsewhere.
This post aims to provide a general overview of what the Network tab is and how you can use it to validate your analytics implementation. There are a lot of other great uses for the Network tab as well, and we’ll mention some of those along the way – but this post certainly doesn’t cover everything you can do with the Network tab.
What is the Network Tab?
The Network tab is what we call the area of your browser where we can see all of the requests for the files required to load a web page, in the order that they are made. We can see what type of file was requested, where it was requested from, how large the file was, and more.
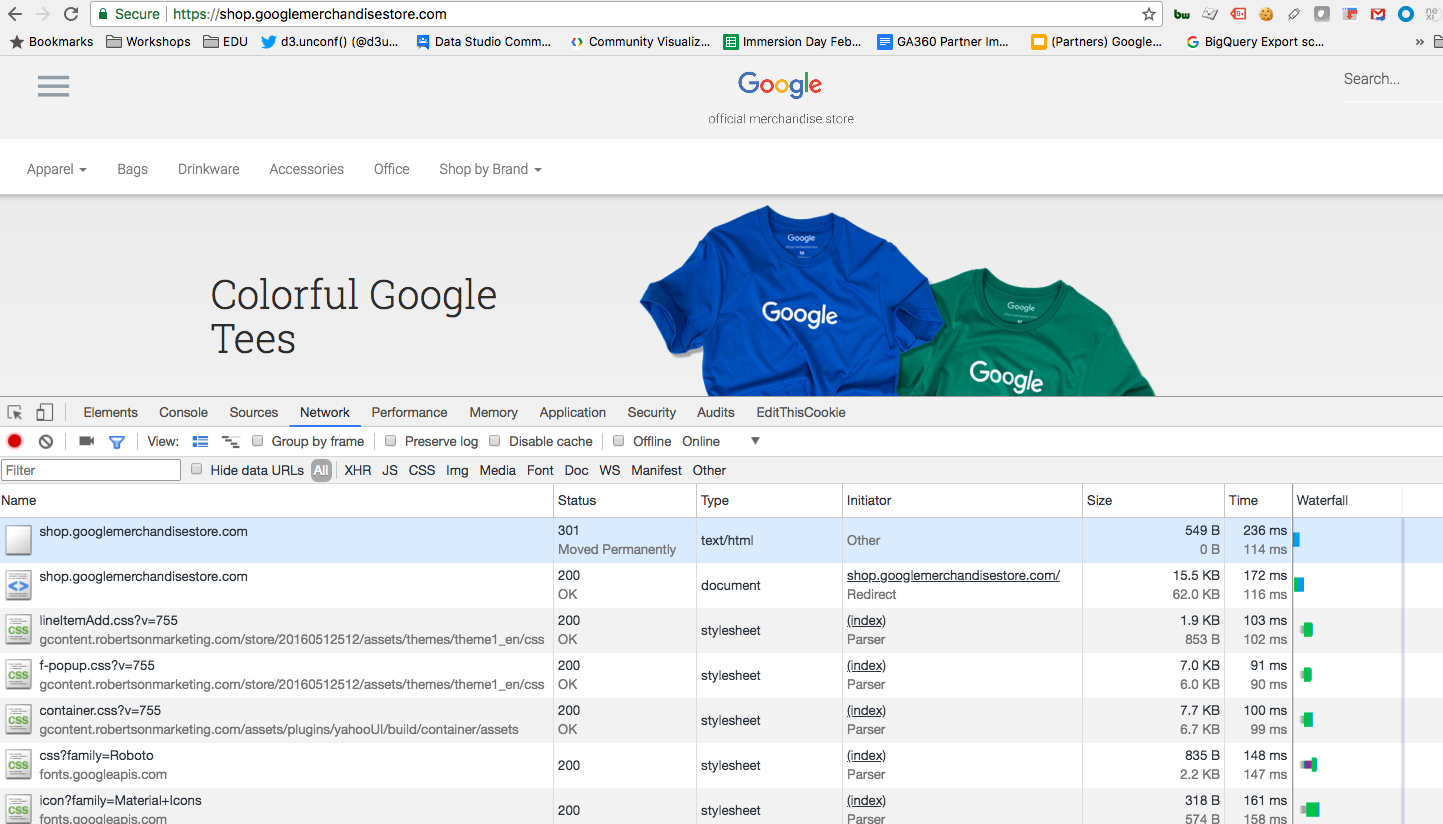
In the effort of validating our analytics implementation, the general concept is the same regardless of which browser you are using: we want to find our Google Analytics hits in the Network tab so we can identify whether or not our Google Analytics tracking code is effectively sending data to Google’s servers when we expect it to, and that all of the correct parameter values are attached.
In this post, I will be using the Network tab in the Chrome browser. You can follow along by opening the Network tab in Chrome via CMD + Option + J (mac) or F12 (pc), or you can choose to play around in another browser, like Firefox’s Network Monitor. You may have to open your browser’s Developer Tools in order to find the Network tab.
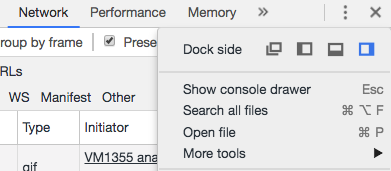
You can also move the Network tab to different areas of your screen (or pop it out into its own window entirely) using the dock options under the traffic signal-like icon in the top right of the toolbar:
The Makeup of a Google Analytics Hit
We will be looking for a request in the Network tab to the following endpoint:
www.google-analytics.com/collect?[params]
We often refer to these requests as our Universal Analytics hits or our Measurement Protocol hits.
We have tracking code throughout our website that sends these requests to Google Analytics, every time a page is loaded or someone clicks a feature we want to track. The requests look like URLs with lots of parameters, and those parameters contain all the info we want to see in Google Analytics.
If you are using Classic Analytics instead of Universal, the data is transferred via a pixel called utm.gif – we’re going to focus on Universal Analytics though.
The pieces of data attached to our hits are formatted as parameters. Here are a few example parameters that you will see:
t: hit type (event or pageview)
dl: document location, or url of the page viewed
dt: document title, or the title of the page viewed
cid: the Google Analytics client ID
tid: the Google Analytics tracking ID
You can check out the full list of available parameters in the documentation – Measurement Protocol Parameter Reference.
My colleague Emily already wrote a great post about how Google Analytics collects data, including some great examples of Measurement Protocol. Check it out below to get introduced or for a refresher:
Published: June 22, 2016
In this article she included a very nice breakdown of the Universal and Classic Analytics hits – let me paraphrase the piece about Universal Analytics specifically, as this is the version of Google Analytics tracking code most of us are working with:
Universal utilizes a /collect request to ask for and return data. The /collect request is a part of the Measurement Protocol which is specific to Universal Analytics. Its parameters specify and store the information you want to collect.
Inspecting Google Analytics Hits in the Network Tab
For fun, let’s check out the Google Analytics hits on the Google Merchandise Store website. You can follow along on your own website, if you’d prefer.
The first thing you’ll want to do is filter the list of requests in the Network tab to just the Google Analytics ones, to make it easier to read. Enter ‘/collect?’ into the filter box in the top-left corner of the Network tab:
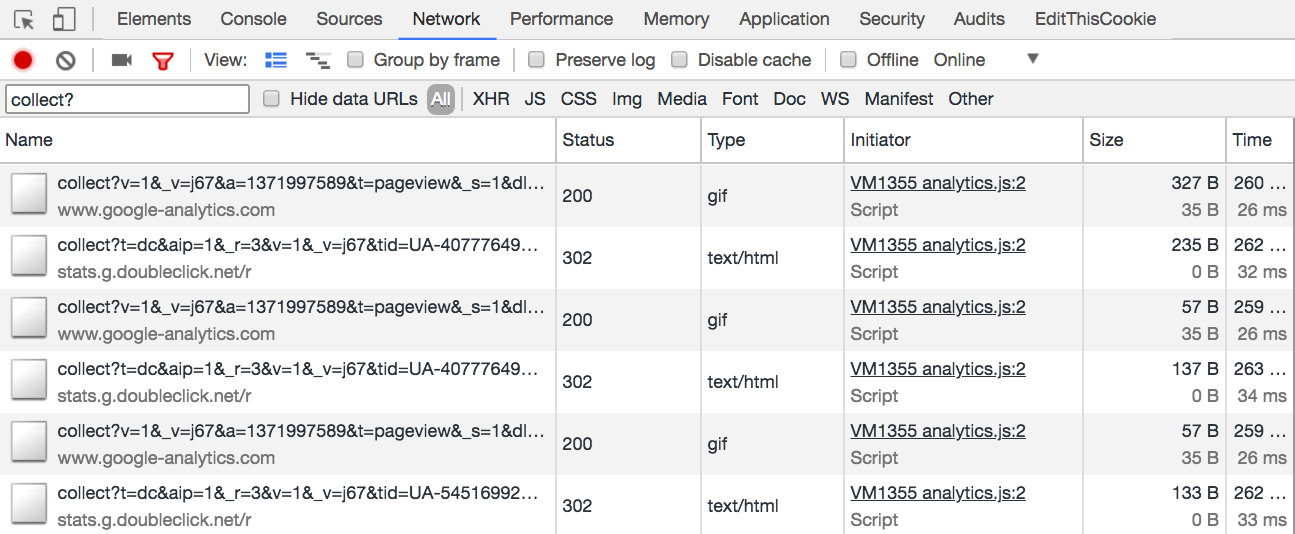
You can get an idea of what type of hit each one was by looking for the ‘t’ parameter, which will show ‘event’ or ‘pageview’ – try clicking on the first pageview you see.
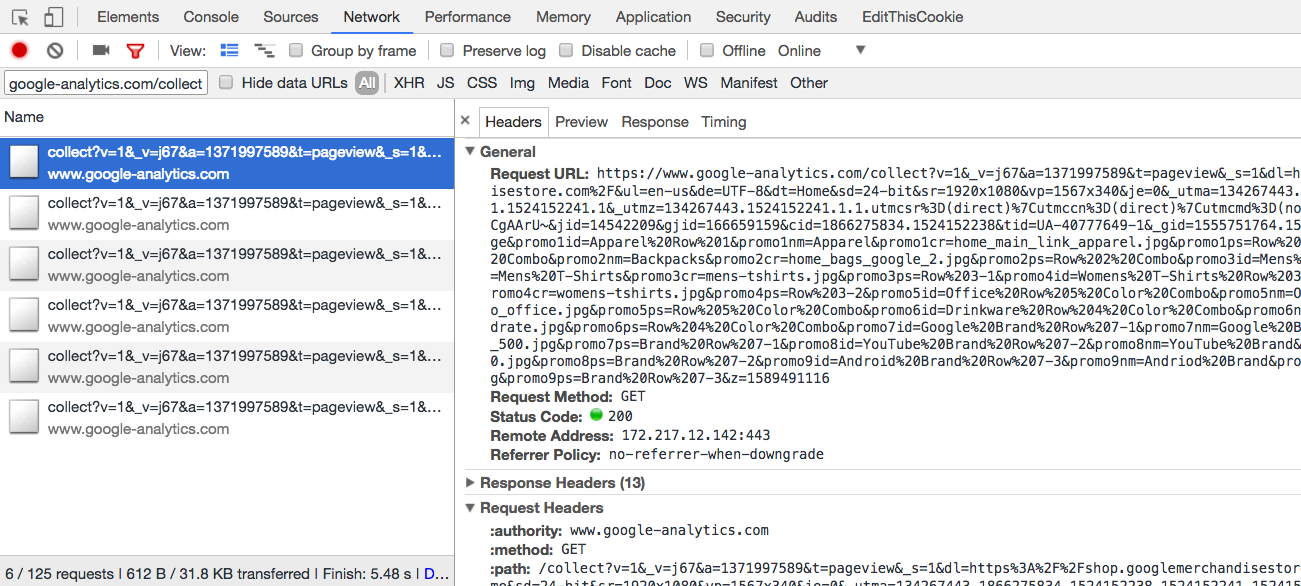
When you select a particular request a panel will appear with additional information about it. The first tab in this panel is the Headers tab. The Headers tab shows the full Request URL (which is the entire hit), the method in which it was requested (GET), the Status Code (whether or not the request was successfully sent, redirected, etc.), the browser’s referer (the previous url accessed before the current one), along with some other information. You can learn more about Headers on MDN if you would like.
Further down in this Headers panel, you can see each of the parameters attached to the request broken out one by one:
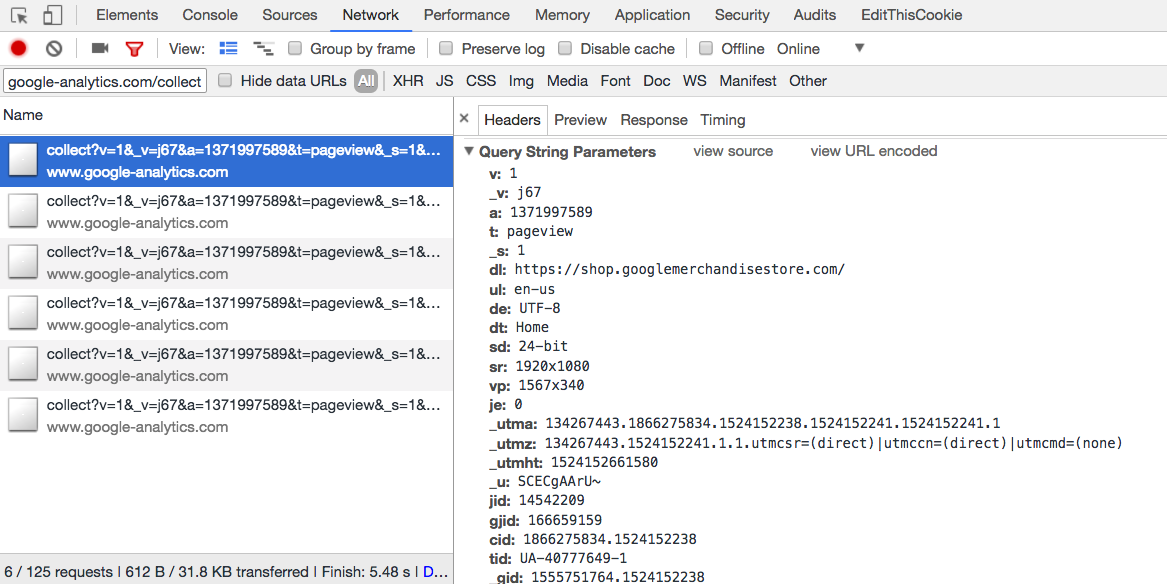
It is much easier to pick out the important parameters this way and make sure that their values are as you expect. For instance, you can see that the data is being sent to the Google Analytics property UA-40777649-1 (based on the ‘tid‘ param).
Below are a few examples of common Google Analytics parameters to check for.
General Hits
t: hit type
dl: document location, or page url
dt: document title, or page title
cid: client ID
tid: tracking ID – the most important one!
gtm: GTM ID (if you are using Google Tag Manager)
Event Hits
ec: Event Category
ea: Event Action
el: Event Label
Enhanced Ecommerce Data
ti: transaction ID
tr: transaction revenue
pr[product index]id: product ID for a given product
pr[product index]nm: product name for a given product
…
You can’t see Ecommerce parameters in Google Tag Manager’s Preview Mode, so it’s helpful to know how to test them with the Network tab.
Custom Dimensions & Metrics Data
cd[index number]: custom dimension for the index number provided (set in the Google Analytics interface)
cm[index number]: custom metric for the index number provided (set in the interface)
Like Ecommerce data, custom dimensions & metrics will be attached to a pageview or event hit.
As you navigate around your website and interact with various features that you are tracking for Google Analytics, you should see the subsequent requests appear in the Network tab. There are two primary questions you should be asking yourself:
- Is my tracking code firing when I expect it to?
- Does my hit include the correct parameters?
When the Network Tab is Especially Useful
There are certain scenarios that the Network tab is especially handy for – cases where other tools may not do the job. I’ve compiled a list of some of the most common ones below. Feel free to point out others you have come across in the comments!
Preserve the Network Log
As long as the Network tab is open in your browser, it is recording requests for you to review. As you navigate around to other pages and click on different things, you may see additional requests appear in the list. Note that if you navigate to a new page, by default the Network tab is cleared out and will start to show only the requests for the new page.
A handy trick for checking your Google Analytics hits for outbound link tracking, form submissions, and other types of interactions that cause you to be directed to a new page is to utilize the Preserve Log feature. Preserve Log allows you tell the Network tab to hold on to requests on the current page as you move to a new page – meaning you can see what might have fired just before you are redirected to a new page.
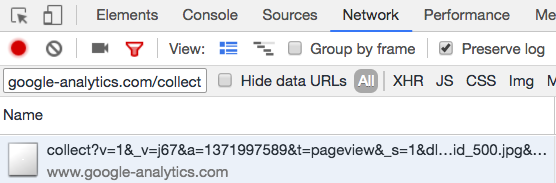
This is extremely helpful for troubleshooting your analytics hits when the browser is trying to direct you to a new page – it prevents the Network tab from being cleared out so you can see what fired just before being directed to the new page.
Investigate Redirects
You may find that some requests have been redirected. Often this happens with Doubleclick requests if you have advertising features enabled in Google Analytics. These will have a Status of 302, which means they were redirected in order to incorporate the data that Doubleclick requires. Requests with a Status of 200 were successfully sent without a redirect.
You can investigate redirects by looking for the 301 or 302 Status, and you can see where the request was redirected to by looking at the location noted under the Response Headers section of the Headers tab for your redirected request:
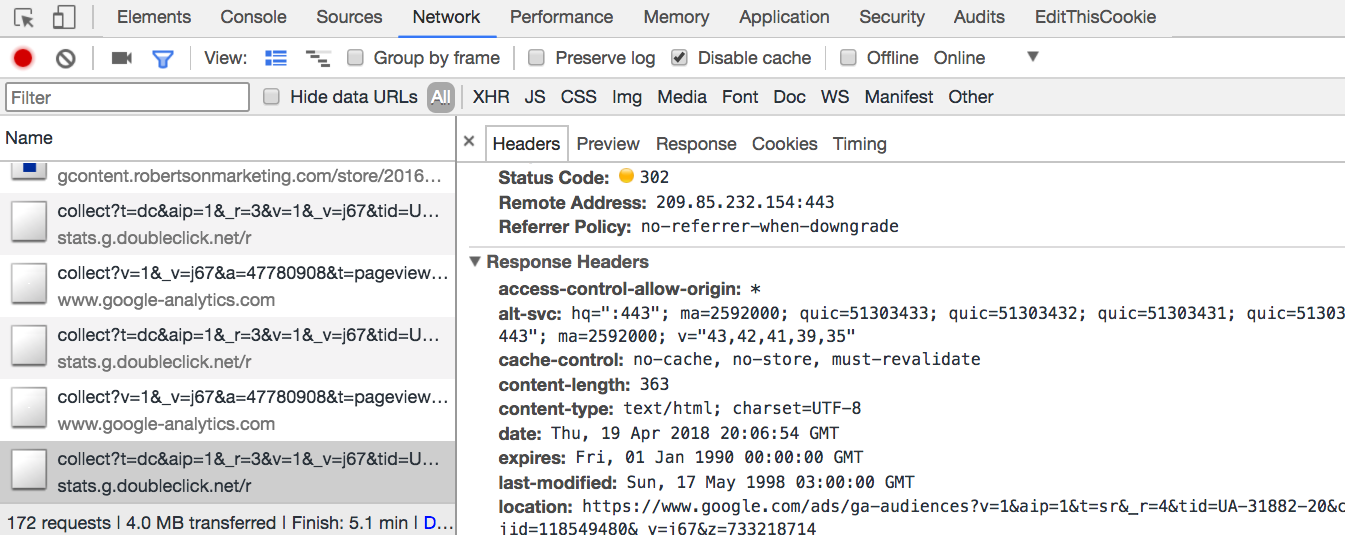
This particular request was directed to https://www.google.com/ads/ga-audiences, which has a Status of 200.
This information is handy if you want to investigate redirects of page urls on your website as well. For instance, if you redirect certain pages on your website with client-side redirects instead of server-side redirects (301, 302), you could have issues where parameters are dropped from the url. If this happens to the AdWords gclid parameter, for example, Google Analytics will have no idea that the user clicked an AdWords ad to arrive on your website. Another example of where this is critical is with vanity urls for ad campaigns – if you’re redirecting vanity urls to your website, make sure that they also use server-side redirects so that the utm campaign tracking parameters are not being dropped in those redirects!
Get to Work!
Test some hits on your website, or share this post with your development team to help them in their analytics QA process. Make sure your hits are firing at the right time, and that they have all of the expected parameters.
Let us know if you have found other helpful analytics-related uses for the Network tab!


