Part Three: Importing Adobe Experience Platform React Native Functionality into Javascript

Now that I have Launch and Adobe Experience Platform (AEP) SDK running in my app, I can start making the most of it. I can utilize the React Native wrapper as a bridge library in order to write my analytics functions in Javascript (once) which will then be transpiled to native (ObjC and Java) code.
After importing the React Native AEP modules into my Javascript file (mine is called App.js) I’ll start by making sure everything is working with a simple console log. Inside the instance of my main App component (React Native uses components just like regular React):
import { ACPCore } from '@adobe/react-native-acpcore';

// Console Log ACPCore Info
ACPCore.extensionVersion().then(version => console.log("AdobeExperienceSDK: ACPCore version: " + version));
  ACPCore.getLogLevel().then(level => console.log("AdobeExperienceSDK: Log Level = " + level));
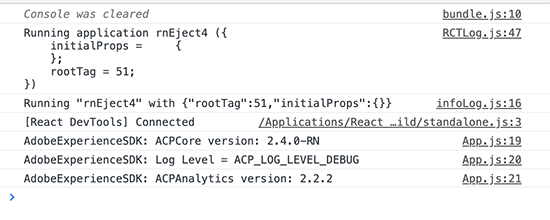
This will log the current debug level and the version of ACPCore I am loading. If everything works as it should, I will see that output in the console of the debug window, the console inside the React Native Debugger tool, the consoles inside Xcode and Android Studio, and/or the terminal window running my React Native server.
Logs in the React Native Debugger console:
These logs indicate to me that everything is working as it should and I am ready to take the next steps of capturing and sending data.
Here are the same logs in the terminal window:
Debugging Tools Tangent
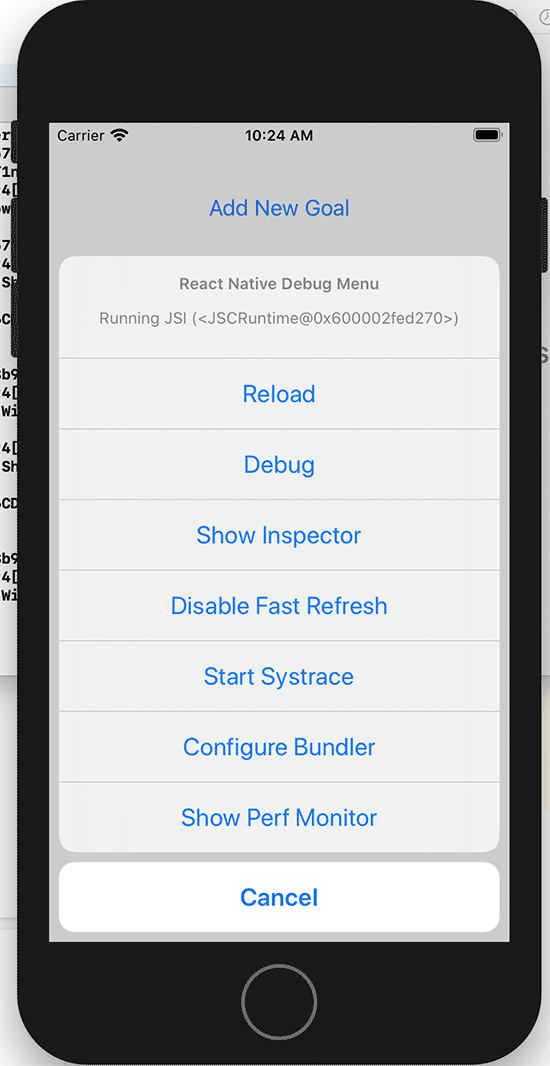
There are two main ways to debug React Native apps: the built in debugger and the standalone React Native Debugger app. While running the app in the iOS simulator, press "command + D" or "command + M" in the Android emulator, to bring up the debug menu and click on debug.
Debug menu in the iOS simulator:
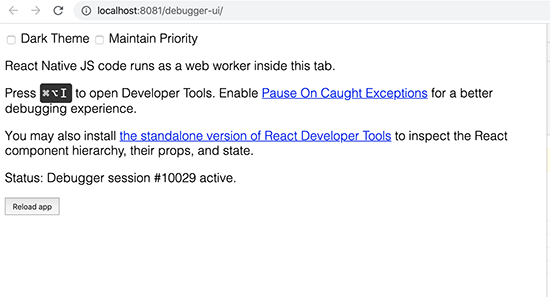
This will open the debug page in a tab in your browser. You can open the developer tools of this page to view the JS console output of the app like you would a regular website.
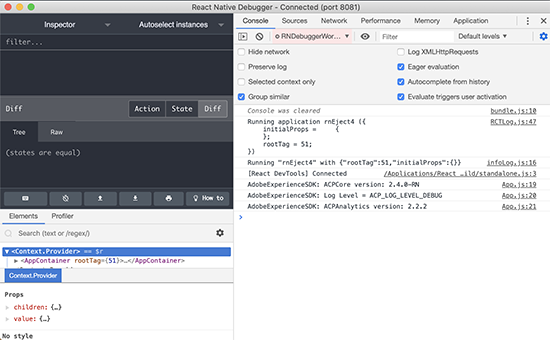
To use the React Native Debugger standalone app, simply open it while you are in debug mode and it will automatically connect. The app offers a few more tools than the debug window, including an web-like inspector for working on style and positioning. I personally like the React Native Debugger app because it saves me a browser tab.
Debug window in browser:
React Native Debugger App:
More on React Native debugging can be found in the official documentation.
Next Steps
We’re almost to the finish line! Visit Part Four: Tracking Screens and Events Adobe Experience Platform SDK using React Native for the final steps to complete.
