Time Comparisons in Adobe Analytics Analysis Workspace
Adobe offers a number of ways to compare time periods in Analysis Workspace. And they each have proper use cases and caveats to understand.
When building a Workspace dashboard that you intend to return to day after day, week after week, or month after month, it can sometimes be unclear if added time ranges will update as expected. In this blog, we'll dive into each type of time comparison in Analysis Workspace.
There are four ways to compare metrics for different time periods:
- Right-click to add a time period
- Right-click to compare a time period
- Drag a timeframe into your table
- Create multiple panels with different time ranges
Below, I've answered some of the common questions surrounding each of these methods.
1. Right-Click to Add a Time Period
Right-click on the metric you want to add a time frame for. Select "Add time period column." Select one of the time period options.
This is a great time comparison method if you'd like to have two columns side-by-side that show data for two different time periods (one of which likely falls outside of your panel's selected time range).
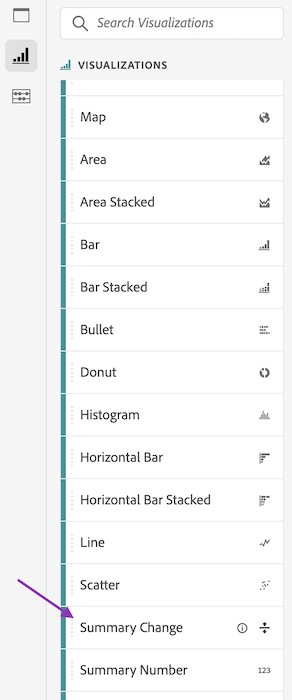
This method does not offer a Percent Change column, but you can use the Summary Change visualization if you need this. Keep in mind that you can also sort either column by selecting the small arrow next to the column total. (Hover over the column total cell to see this arrow and click it. Click the arrow again to reverse sort order).
Will the Added Time Period Update Automatically?
It depends. If the time range for your panel is an out-of-the-box (OOTB) or pre-built range like "Last Week," and you select a non-custom comparison time range like "Prior week to this date range," or "This week last year to this date range," then Yes! Your newly added time period column will adjust accordingly as time goes on. If you have a custom date range for your panel or if you select to add a "custom date range" column, then the newly added date range will not update as time goes on.
What Happens If I Change the Time Frame of My Panel?
Your newly added time frame column will remain as-is. It will not update to a different time period.
How Can I View the Variance Between the Two Numbers?
Use a Summary Change visualization to get this variance number.
QUICK TIP: The time frame of your panel matters. If you select a custom date range, your time comparison options will be more limited. It's ideal to select a standard time frame for your panel like "Yesterday," "Last Week," or "Last Month."
2. Right-Click to Compare a Time Period
Right-click on the metric you want to compare. Select "Compare time period column." Select one of the time period options.
The "Compare time periods" option functions the same as the "Add time period column" selection. The benefit of comparing time periods is the availability of a Percent Change column. This added column has conditional formatting making it easy to interpret.
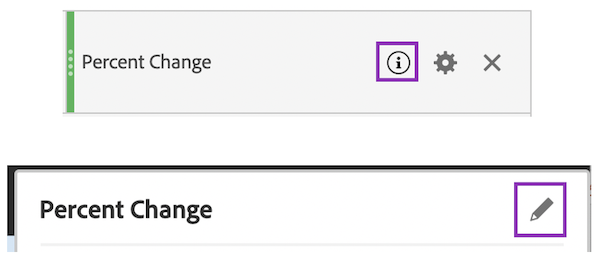
QUICK TIP: To rename the "Percent Change" column, just hover over the column header and select the "i" icon. Then select the pencil icon on the pop-up. This will take you to a screen where you can edit this newly created metric. This is helpful if your table includes multiple Percent Change columns and you need to clarify which is which.
3. Drag a Time Frame Into Your Table
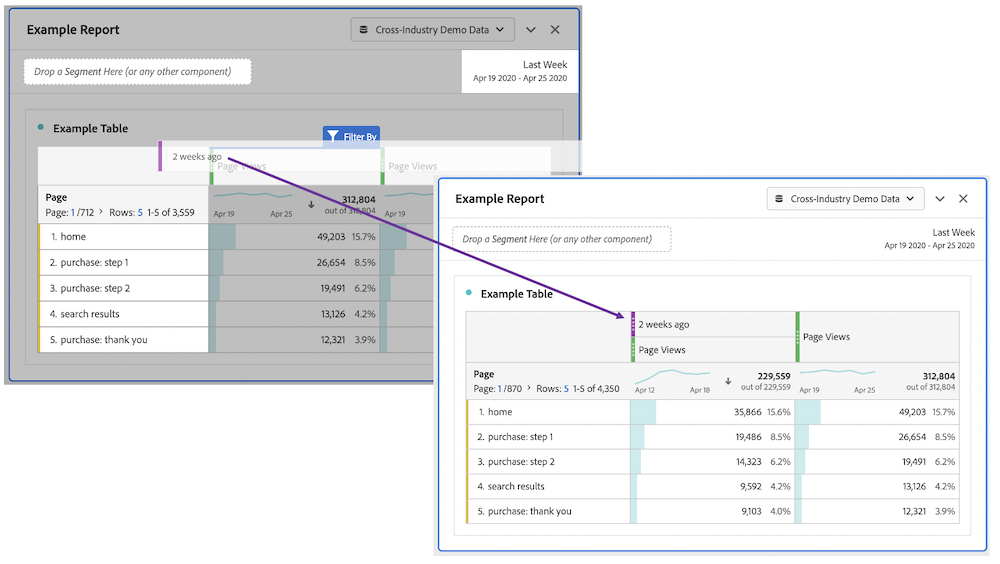
Drag the same metric into your freeform table twice. Then drag a purple time frame from the Components panel into your table as shown below.
This is a really nice option that looks clean and clearly states the data time frame. It's ideal if the time frame you need is a standard time frame that comes OOTB from Adobe (or that you've already created by navigating to Components > Date Ranges). The downside to this time comparison method is that you don't automatically get a variance column.
Will the Added Time Period Update Automatically?
Yes! These are dynamic time ranges that will update as time passes. They're clearly labeled, so you always know what you're looking at.
What Happens If I Change the Time Frame of My Panel?
The time range of your panel has no effect over OOTB date ranges that are pulled into your table from the Components tab. If you pull the date range "Last 30 Days" from the Components tab into your table, that row or column will always show data for the Last 30 Days.
What If the Date Range I Drag-On Doesn't Fit Within the Time Frame Applied to My Panel?
The date range you pull into your table has nothing to do with the time frame applied to your panel. You can change the panel's time range to whatever you want, and the column with the purple date range applied will remain the same.
For example, in the image above, I have selected to view "Last Week" data in my panel. I dragged on the date range of "2 weeks ago." Two weeks ago does not fall into Last Week, and that's not an issue. My goal is to be able to compare Last Week to the week prior.
How Can I View the Variance Between the Two Numbers?
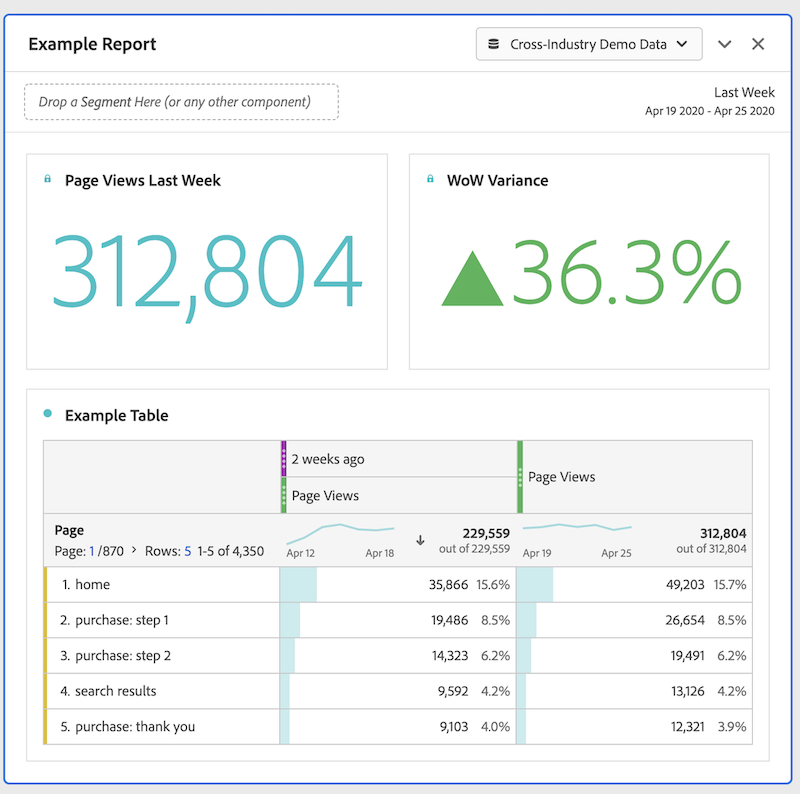
Use a Summary Change visualization (pictured below) to get this variance number.
4. Create Multiple Panels with Different Time Ranges
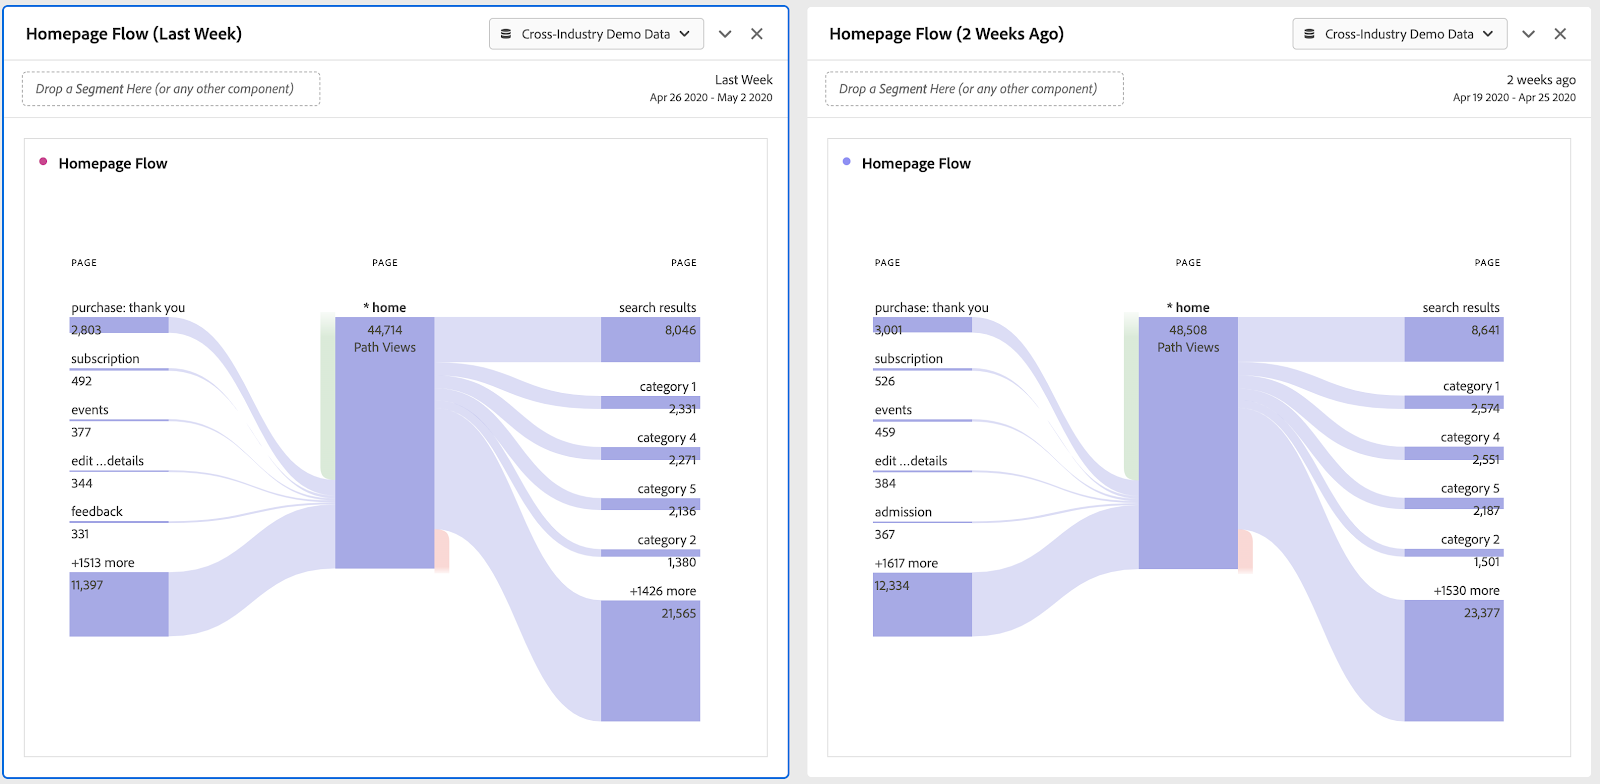
Add two panels to your project. Select your time ranges for each panel. Size your panels to half-width. Add a table or other visualization (Flow, for example).
Some visualizations don't offer easy time comparison functionality. Flow and Fallout visualizations are examples of this. To compare time periods with visualizations like these, you can use side-by-side panels.
QUICK TIP: For optimal space alignment, drag the bottom of each panel to expand the panel length. This will keep the panel from adjusting itself as the data updates within each visualization.
Something to Keep in Mind
Be careful comparing time periods like "Last 7 Days," "Last 30 Days," and "Last 90 Days." These "Last X Days" time frames include today's data. If, for example, you compare the "Last 7 Days" with the 7 days prior, you'll be comparing 7 full days of data with 6 full days and a partial day of data. This is not recommended. Similarly, if you compare "This Year" to "Last Year," keep in mind that "This Year" is incomplete.
Time Comparison Methods
There's no right or wrong method for effectively comparing your data's metrics in different time periods, but based on some criteria, you may find one method works better than others.
Now that you know the ins and outs of all four time comparisons in Adobe Analytics Analysis Workspace, you can decide which follows your processes and begin to implement today.

