Adobe Analytics Participation Metrics and How to Set Them

What is a Participation Metric? Participation is an attribution model and a participation metric is a metric that uses this model. Participation differs from other common attribution models in that it assigns full credit to all touch points within a visit that leads up to the conversion. This includes all eVars regardless of expiration.
Let's look at an example. Say a user visits our site and views three pages, let's call them Page A, Page B, and Page C. On Page C the user completes a purchase worth $100. The table below shows how much credit each page receives under various attribution models.
| Last Touch | first touch | linear | participation | |
|---|---|---|---|---|
| Page A | $0 | $100 | $33.33 | $100 |
| Page B | $0 | $0 | $33.33 | $100 |
| Page C | $100 | $0 | $33.33 | $100 |
Two things probably jump out at you about this table. The first is that all of the attribution models except for participation have a sum of $100 across the three pages, whereas with participation the sum is $300. This is an important point to keep in mind when viewing a report with a participation metric, the sum of the line items in the report will be greater than the total. See below for an example of how such a report would like in Adobe Analytics Workspace.
The second is that both linear and participation evenly attribute revenue across all three pages. The difference is with a linear attribution the more touch points that occur before conversion, the less credit each touch point receives. This punishes pages on paths with more touch points and rewards pages on paths with fewer touch points.
Let's look at a second example. This time we will look at what happens when we have two paths with varying lengths. The first will be Page A > Page B > Page C > Page E with a $100 conversion on Page E. The second path will be Page D > Page E with another $100 conversion on Page E.
The table below shows how much credit each page receives under the same attribution models we used in our first example. Under a Linear attribution model, each page from the first path receives $25 worth of credit while each page in the second, shorter path receives $50 worth of credit.
| Last touch | first touch | linear | participation | |
|---|---|---|---|---|
| Page A | $0 | $100 | $25 | $100 |
| Page B | $0 | $0 | $25 | $100 |
| Page C | $0 | $0 | $25 | $100 |
| Page D | $0 | $100 | $50 | $100 |
| Page E | $200 | $0 | $75 | $200 |
Whether you should use a linear or participation attribution model will depend on the business question you are trying to answer. Some common business questions that would require a participation metric include "How many pages did the user view after viewing page x?" (this is known as page velocity) or "What percentage of our conversions included a page view of page x?" If instead, you are trying to measure the ROI of various campaigns you may want to use a linear attribution model.
Now that we have a good handle on what a participation metric is, let's discuss how to implement them. There are three ways to do this: through the admin settings; by creating a calculated metric; and directly within a Workspace project. I'll cover the steps required to set up a participation metric with each method, and the pros and cons of each.
Setting Participation in Admin Settings
The traditional method for setting up a participation metric, dating back to the Omniture SiteCatalyst days, is to use the Admin settings. To do this:
- Navigate to Admin > Report Suites
- Select your report suite
- Click Edit Settings > Conversion > Success Events
- Within the listed success events find the one you want to enable and in the Participation column select "Enable"
It's important to note that this option is only available for events 1-100. Now that we have the success event configured if we navigate to Reports and Analytics we will see a new metric available called <Success Event> Participation. This will work with all eVars, but what about props? If we want to use a participation metric with a prop then the prop must also have participation enabled. To do this:
- Navigate to Admin > Report Suites > Edit Settings > Traffic > Traffic Variables
- Select "Enabled" in the "Display Participation Metrics" column for each prop you want to use with a participation metric
The benefits of creating a participation metric this way are two-fold. First, the metrics are available everywhere in Adobe Analytics with the exception of Workspace. The second is the metrics are automatically available to all users.
There are several drawbacks to this method, however. Arguably the most important being participation metrics created using this method are not available in Workspace, the go-to tool for creating dashboards. This method also requires Admin access, which can be a pain if you don't have it and want to use a new participation metric.
Furthermore, once you get your Admin to set it up for you, the participation data is not retroactive, which means you cannot use the metric in any report that contains a date range from before the participation metric was created. As mentioned above, only events 1-100 can be created using this method, and these events can only be used with eVars and participation enabled props.
Creating a Participation Metric Using Calculated Metric
The second option for creating a participation metric is to use a calculated metric. Unlike the previous method, this one does not require admin access. To create a calculated participation metric:
- Navigate to Components > Calculated Metrics
- Click the +Add button
- Within the Calculated metric builder drag and drop a metric to the definition section
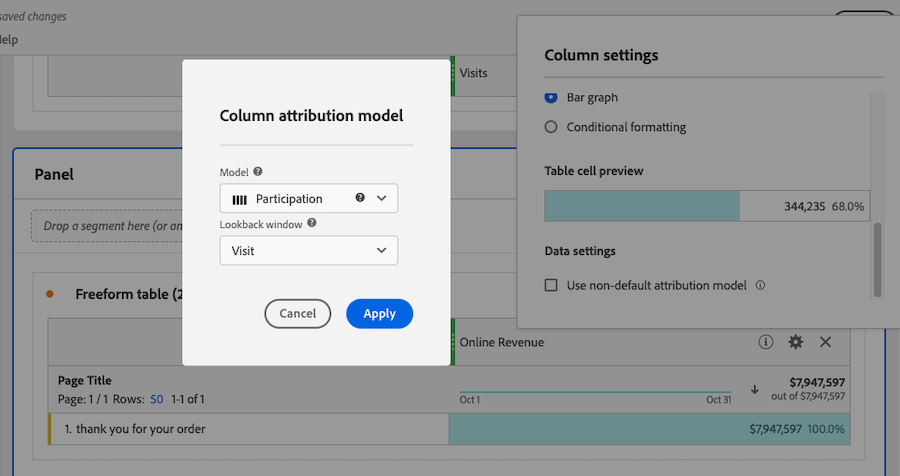
- In the container where your metric is, click on the gear icon
- Select "use non-default attribution model" check box
- From the Model drop-down menu select participation
- From Lookback Window select either visit or visitor (typically visit)
- Give your new metric a title (ideally with the word "participation" in it) and click save
There are many benefits to using this method over the Admin method, the most obvious being it can be done without the need for Admin access. The other main advantage is calculated participation metrics are available within Workspace. Finally, the participation data is retroactive when using this method.
The main drawback of using this method is that calculated metrics are not available for use within all tools in Adobe Analytics. The following is a list of tools in which calculated metrics are not available:
- Funnels in Reports & Analytics
- Fallout in Analysis Workspace
- Cohort Analysis in Analysis Workspace
- Data Warehouse
- Segments
- Real-Time reports
- Current Data reports
- Analytics for Target
Creating a Participation Metric Directly Within Workspace
The final way to create a participation metric is directly within Workspace. This is a great option if you only plan on using the metric once. Unlike calculated metrics, you will be directly modifying the report settings and will not be able to share the metric for future use in other reports. To create a participation metric within Workspace:
- Create a new freeform table that includes the metric you want to enable participation for;
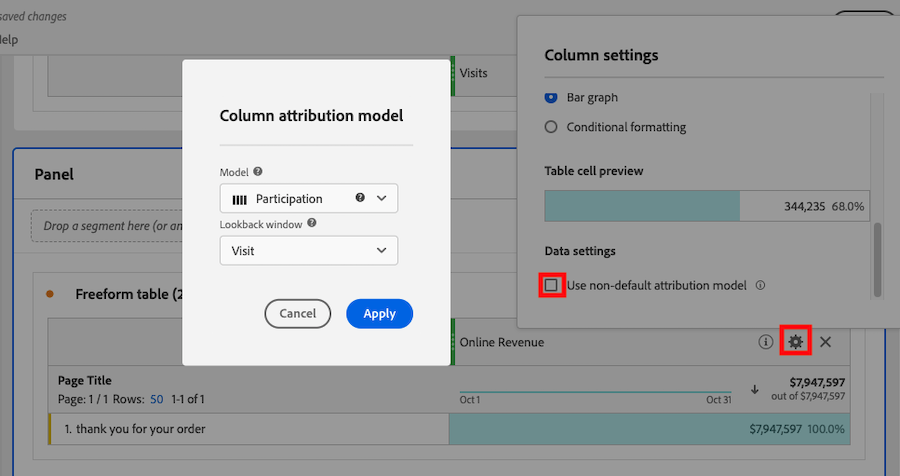
- Click on the gear icon in the header next to the metric title;
- At the bottom of the modal window select the Use non-default attribution checkbox;
- From the Model drop-down menu select participation;
- From the Lookback Window select either visit or visitor (typically visit).
Your freeform table is now configured to use a participation version of that metric.
Of the three ways to create a participation metric, this one is the quickest. Similar to the calculated metric method this can be done without requiring Admin access, the participation data is retroactive and the metric is, of course, available in Workspace. The final advantage of using this method is that it doesn’t flood your metrics list with metrics you only plan on using once.
There are downsides to using this method as well. Participation metrics created using this method are only available in Workspace. If you plan to use the participation metric more than once, you will have to go through the entire process every time you want to use it. Finally, metrics created with this method cannot be shared with other users.
Conclusion
We've now covered the three different ways of creating a participation metric (though Admin settings, with a calculated metric, and directly within Workspace) and the pros and cons of each approach. Which method you should use depends, of course, on your specific requirements.
In general, if you only want to use the metric once in Workspace use the Workspace Metric. If you need to use the metric in Data Warehouse or another tool where calculated metrics are not available then use Admin. Otherwise use a calculated metric.
If you are an admin setting up a new report suite and wondering whether or not to enable participation metrics, I would recommend they should not be enabled, unless there is a specific use case. A calculated metric can always be configured later if needed.
Check out the quick guide reference below:
| Admin settings | calculated metric | directly within workspace | |
|---|---|---|---|
| Requires Access to Admin Settings | Yes | No | No |
| Available in workspace | No | Yes | Yes |
| Shareable with other users | Yes | Yes | No |


