Enterprise DevOps with Adobe Cloud Manager
It has been a couple of years now since Adobe introduced its Experience Manager as a Cloud Service offering. Adobe Cloud Manager enables organizations to continuously evolve and improve the speed and ability to deliver a quality product. Organizations are tasked with adapting to new ways of working to stay relevant and deliver greater business value. To benchmark themselves and work on continuous improvement, clearly defined KPIs need to be established at the organization level.
Traditionally teams get funded for a specific set of solutions to be developed and success is defined by delivery of the agreed-upon scope on time and on budget. Adjusting our approach to KPI-based development, the focus is on the business outcome and the teams need to benchmark themselves and thrive for continuous improvement. Tools and frameworks for KPI-based development have become imperative at the enterprise level so that teams work towards common goals to achieve delivery excellence. While business outcomes may be focused on customers and improving organization excellence, the KPIs that are defined include internal Metrics that need to be met to achieve those business outcomes.
Business outcomes can be Speed to Market, Value of the Product, Quality of the Product, Reliability. Some of the KPI Metrics that can help you track the business outcomes in the overall DevOps setup include:
- Lead time to Change
- Deployment Frequency
- Mean Time to Recovery
- Application Performance
- Automated Test pass %
- Error rate
- SLA
Lead Time to Change
Time it takes to ship a feature from Ideation to deployed state
Clearly defined 'Definition of Ready' (DOR) and 'Definition of Done' (DOD) from the Product team helps to track a deliverable. Measuring the time spent on an Ideation phase like a Technical Spike helps in prioritization and shaping the team with the right level of expertise. Measuring the amount of automation and optimization it brings in in terms of reduction of defects and time to market helps to gauge the effectiveness of the automation suite.
- Time taken for the Feature to pass DOR acceptance criteria
- Time taken for the Feature to pass DOD criteria
- Planned Effort
- Actual Effort
- Defect Leak Rate
- Defect Aging Rate
- Number of Defects
Deployment Frequency
How often the Team deploys the build to Non-Production and Production Environments
A higher number of builds as small features help to release the code faster. In order to deploy more, the build time needs to be short with a low deployment failure rate.
Time to Recovery
Time taken to detect and restore the system from a failure and deploy a change
Measuring the time to restore a system from backup and how quickly a new issue can be identified plays a critical part in monitoring the application. Good monitoring tools help keep track of an application within SLA. Systems parameters need to be monitored proactively and alerts configured on critical business functions to increase system reliability.
Application Performance
Logs, cache percentage, scalability, server response time, number of error responses, page load time, etc.
Monitoring application performance parameters helps in measuring the reliability of a system. Cloud Manager provides business users the ability to configure performance KPIs on Sites and Assets instances.
Automated Testing
Percentage of the application covered under automated tests, types of automated tests, and the average time taken by the automated tests
Automated tests are living documentation and an effective automation suite can reduce the total cost of ownership of the product.
- Visual Testing
- Functional Automated Tests
- Performance Tests
- Analytics Testing
- Accessibility Testing
- Security Testing
Cloud Manager Integration
While Cloud Manager allows business owners to set up some of the basic performance and security-related KPIs when spinning up a new program, organizations need to leverage additional tools to build a centralized DevOps Dashboard at an enterprise level. Adobe I/O provides extensibility solutions to build and manage integration with Cloud Manager to pull metrics data. An illustrative view of how enterprise systems integrate with Cloud Manager through Adobe AIO is provided below.

There are three ways through which external systems can consume Cloud Manager Events:
- AIO Cloud Manager Plugin or Cloud Manager SDK API
- Journaling API
- Event Subscription via Webhook or Runtime Action
The first two are pull-based models that fetch information on demand through well-defined APIs. The third option is a push-based model where Cloud Manager will send messages to notify subscribed Event Handlers.
Integration Via Adobe AIO Cloud Manager Plugin
Use cases to pull build and environment-related information from Cloud Manager can leverage this AIO plugin. This plugin integrates API services created over Adobe AIO to manage Cloud Manager integration. Commands can be used in scripts to automate build tasks. Authentication can be either browser-based or by service account. With respect to scripting, we will leverage service account authentication. In order to manage the interaction with Cloud Manager, an API service needs to be created with appropriate roles and permission in the Adobe Developer Console of your organization. Below are the steps to create an API service.
Step One: Create a Project if not created in Adobe Developer Console.
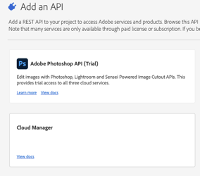
Step Two: Add an API service to Cloud Manager in Adobe Developer Console for this project.

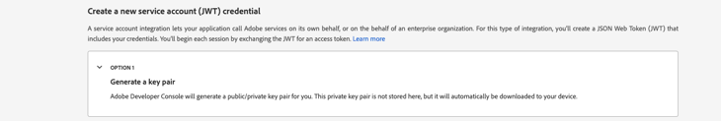
Step Three: Create a key value pair (if not done already) with necessary product profile access.
Step Four: Download the private.key file to your local folder.
Step Five: Create a named config.json file in your local folder and populate the values from the Developer Console.

Step Six: Configure your command/terminal with authentication context. In your terminal, issue the following commands to set the auth context using the private key and the config.json file.


Once an authentication context is established we are all set to execute commands from the terminal or as a script. For example, we can run a script as a command line utility from an on-premise CI/CD tool to fetch the Cloud Manager build status, step details, and logs, and then notify the subscribed group with necessary details. I have listed some of the commands below to fetch the data required to calculate 'Deployment Frequency' KPI metrics.
- List Programs for an Organization
- List Pipelines for a Program
- Fetch Current State of a Pipeline
- List All Executions for a Pipeline
- Fetch Step Details for an Execution
List Programs for an Organization: Often an organization can have multiple programs and the list of programs under the organization needs to be fetched. A DevOps Admin can configure the Program under which the scripts need to be executed and filter metrics as per the Business Unit.

List Pipelines for a Program: Lists the set of all pipelines along with their status. Admins can select from a list of pipelines that need to be triggered. Adobe Cloud Manager provides Non-Production and Production deployment pipelines to manage the different environments.

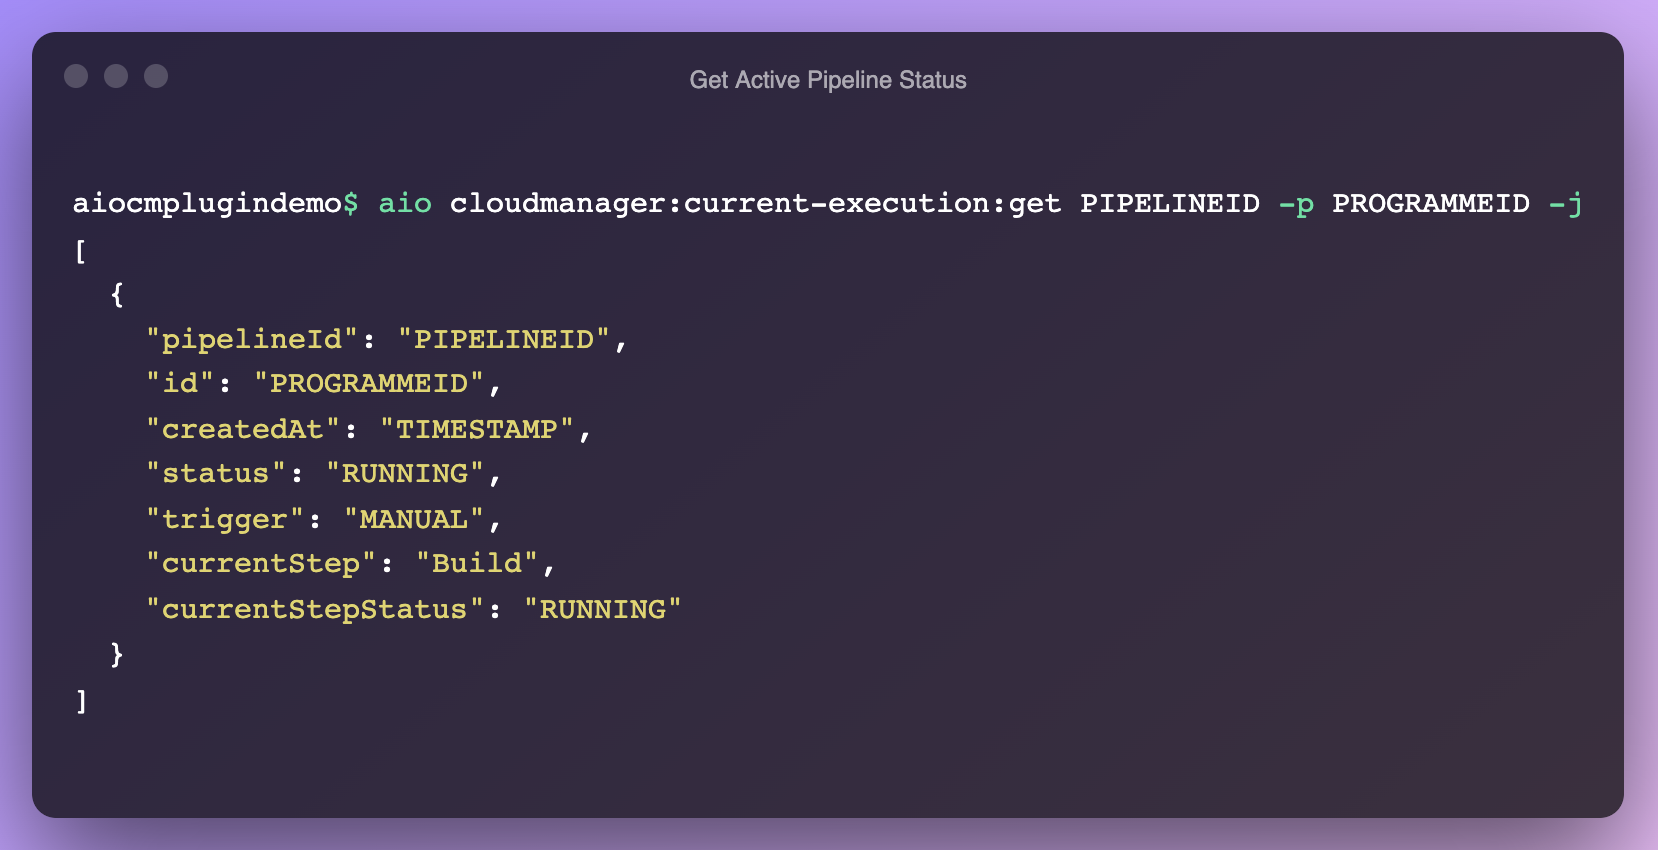
Fetch Current State of a Pipeline: Cloud Manager pipelines can be configured to be triggered on new changes or on-demand. In order to get the current state of a given pipeline, the below command can be executed. In the case of no active execution for the pipeline, the command throws an exception that can be trapped.

For an active pipeline, the command returns the current execution status and current state details of the pipeline. External systems can poll Cloud Manager for the current state and take appropriate action.
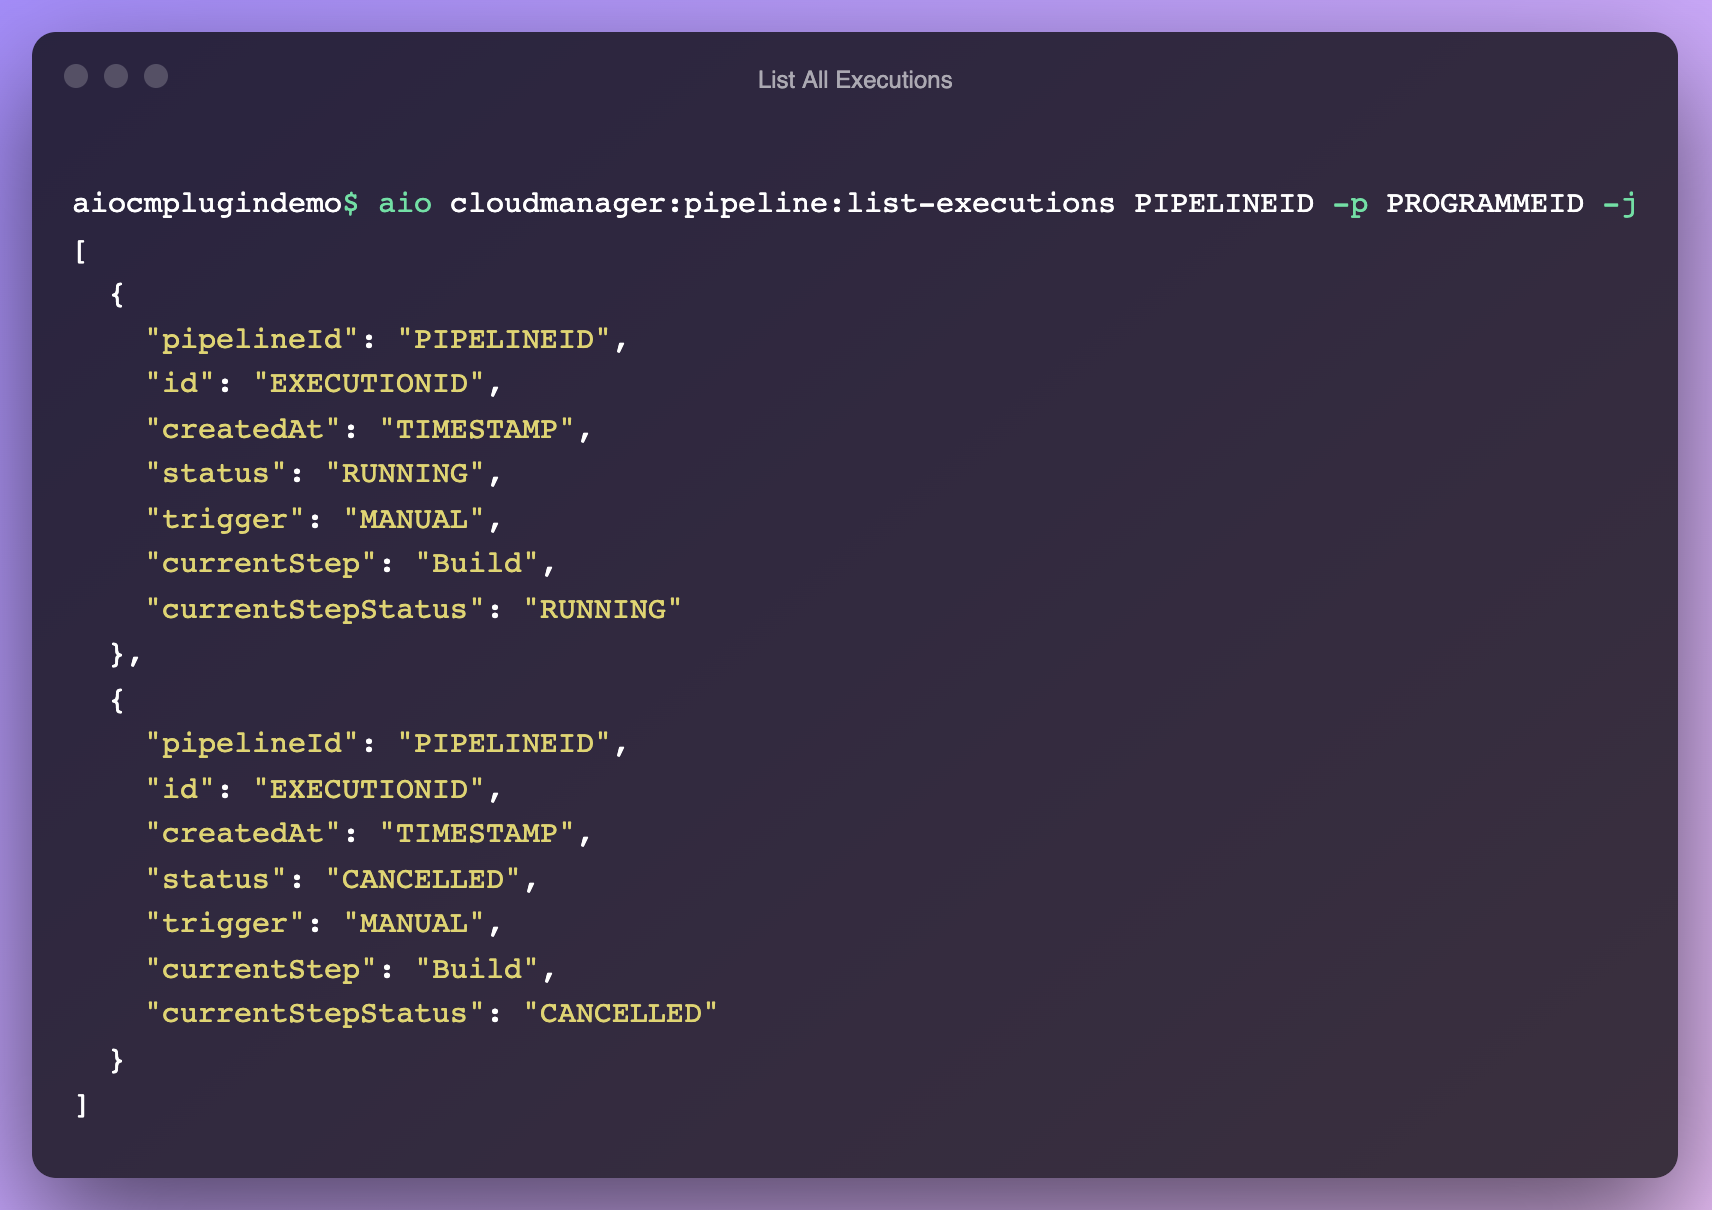
List All Executions for a Pipeline: In order to fetch all the executions and overview details of a pipeline, the list executions command can be used. The response includes details such as time the execution started, the current status of the execution, the current step, and the build trigger. Some examples of data that can be derived from this list include the time taken for a deployment and the number of deployment failures.
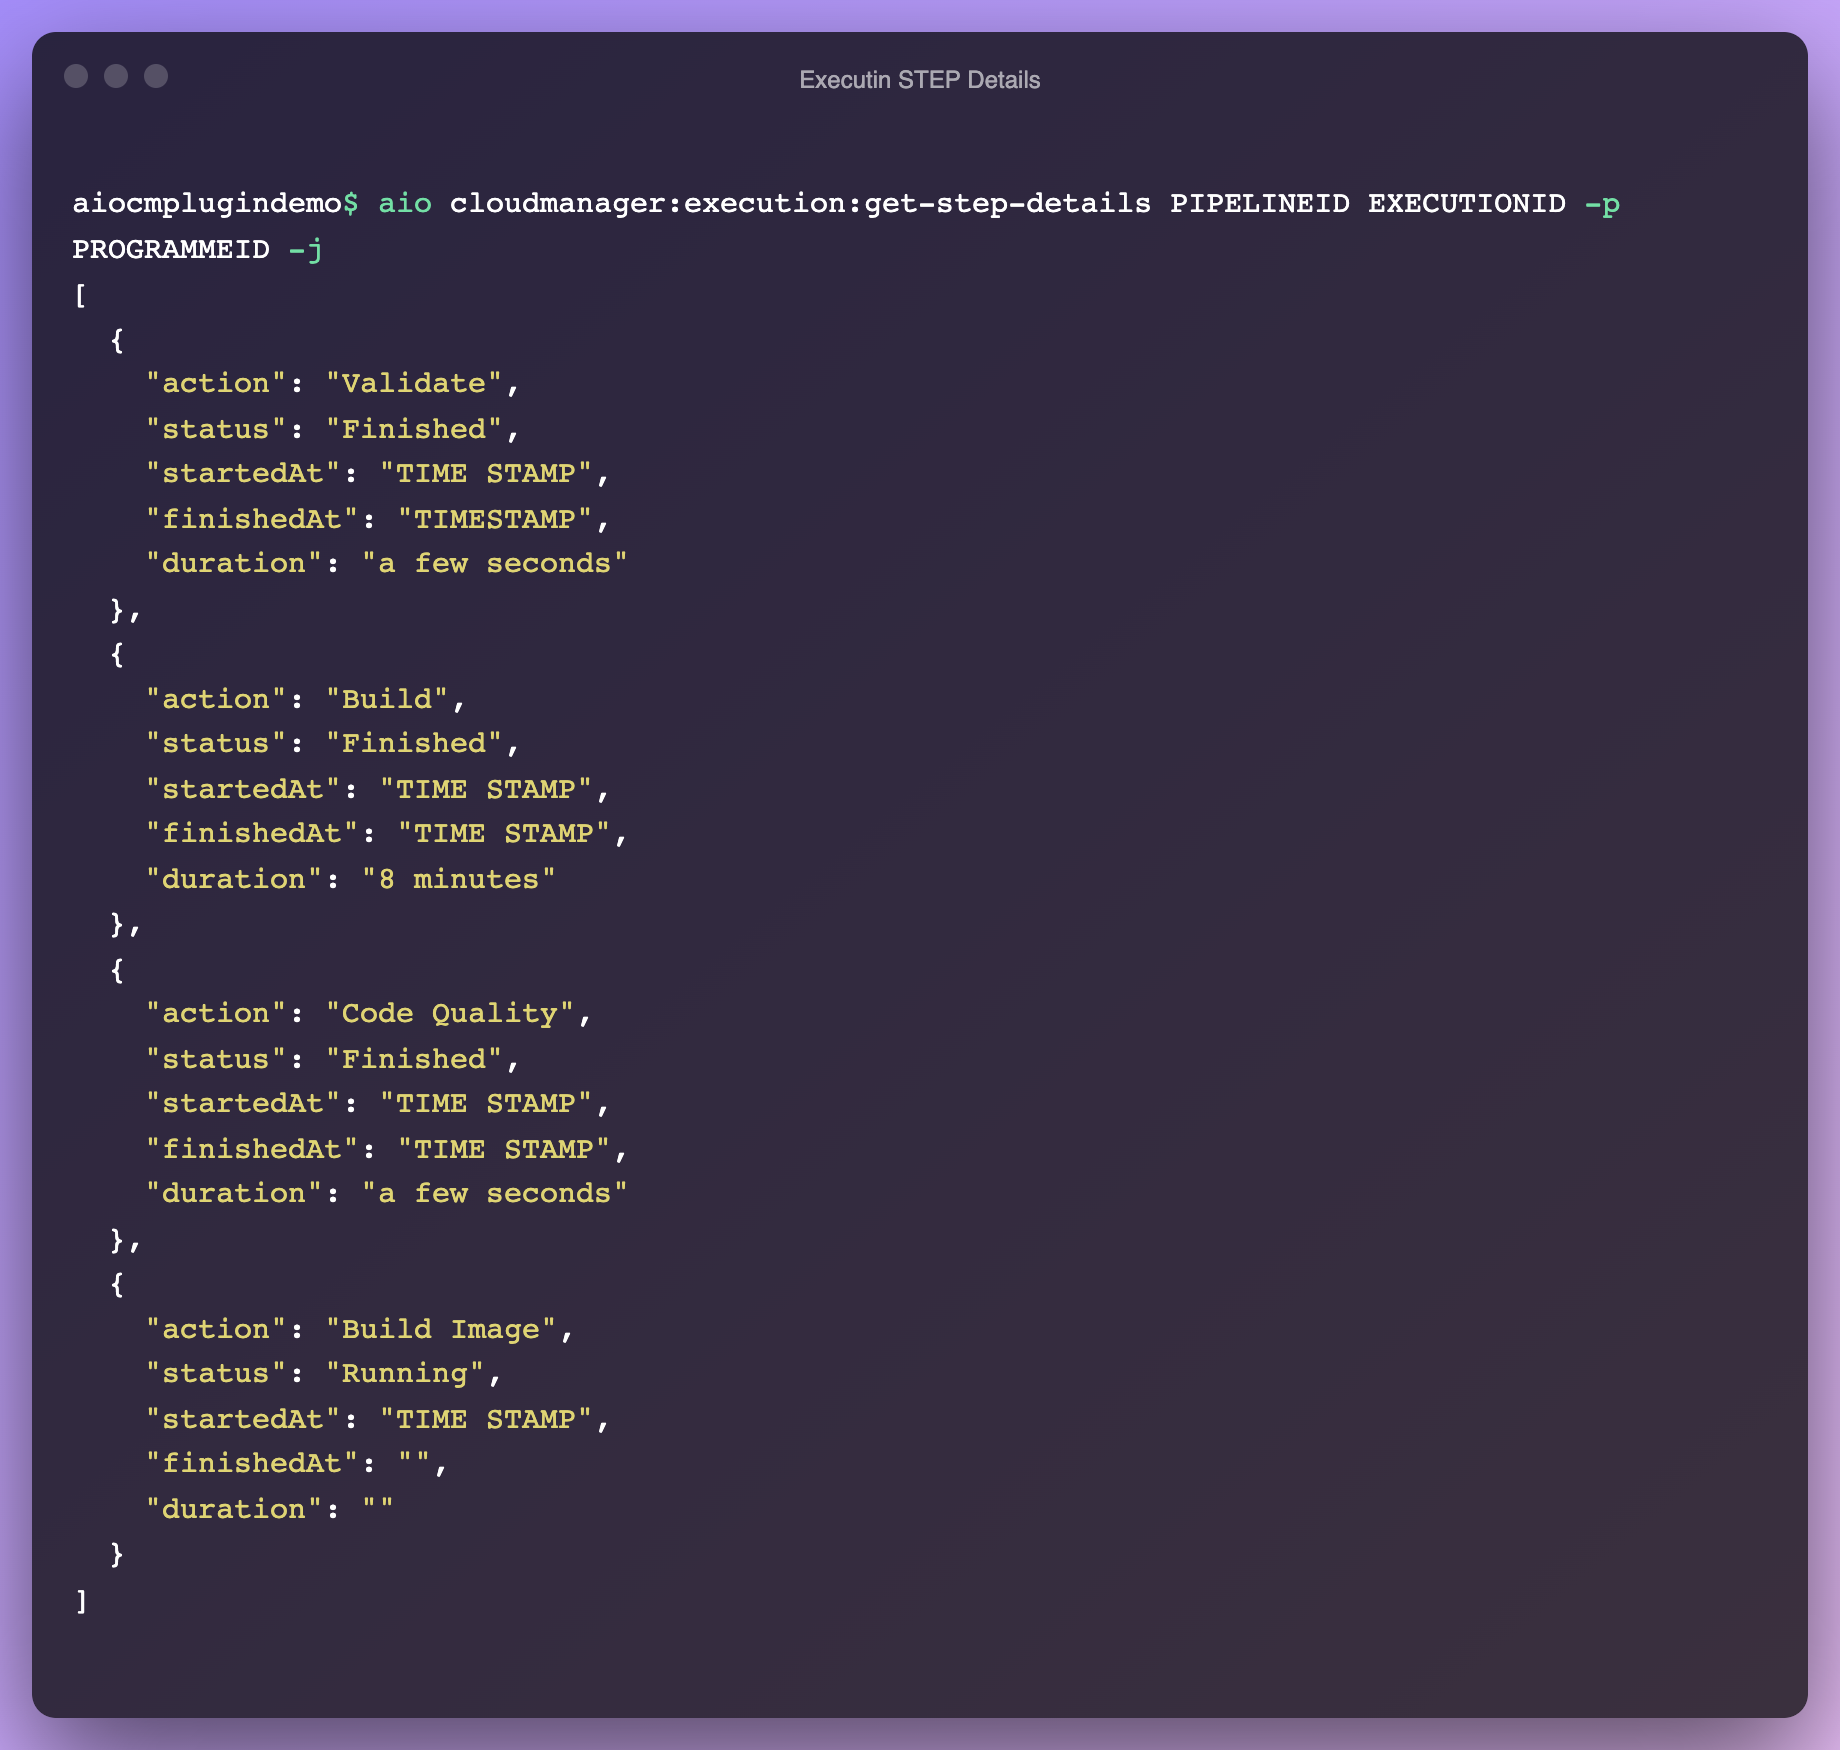
Fetch Step Details for an Execution: The number of steps for an execution and the details of the individual steps can be fetched using the get step details command. Keeping track of Average Deployment Time and time spent by the individual steps helps us to optimize the build and improve productivity.
One final note on all of the AIO commands above is that, though I've shown all results in the default JSON format, YAML output is also available if that is your preference.
More Is Possible With Enterprise DevOps on AEM
Clearly defined KPIs need to be established at an organizational level to stay relevant and deliver maximum business value. Leveraging additional tools to build a DevOps Dashboard by integrating Adobe I/O with Adobe Cloud Manager can help measure progress toward these KPIs at an enterprise level.
This article covered integration with the Adobe AIO plugin to pull information on demand, but what if your application can instead register for the required Cloud Manager events? What if you need to process Cloud Manager data in Bulk? And how do you integrate with a centralized DevOps Dashboard? There's a lot more possible with Enterprise DevOps on AEM.
News & Insights
Related Perspectives