Guide To Google Analytics Site Speed Metrics

Typically, the excitement of reporting with Google Analytics starts with looking into your site’s audience, content and conversions. These reports steal the show by answering questions like which pages are most popular and which content is most valuable.
While these are important data to analyze and share, consider the metrics about how your website is keeping up with traffic and how it is performing. No matter how popular, SEO-friendly or sleek your site is, if there are pages or sections that take a long time to load, users may leave or bounce.
The website may seem quick and reliable on your device, but different browsers, ISPs, devices and a host of other factors may affect someone else’s experience. It’s very rare that a user will visit a site and later send a message describing where it seemed slow or which pages took too long to load.
If users are getting frustrated and leaving the site before converting, we may never know about the reason why. Lucky for us, there are standard reports as well as dimensions and metrics that can be paired to tell a story of how quickly your pages are loading.
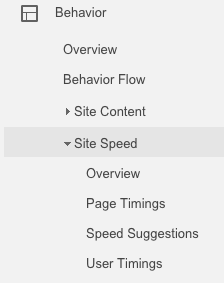
The easiest thing you can do to start viewing these data right now is to go to the standard Site Speed reports that are automatically available. These are located in the main left-side navigation under Behavior > Site Speed.

BUT- before you dive in and begin analyzing, take a moment to get to know these numbers and what they mean.
The Metrics
The group of metrics I’m going to talk about can be used to track the speed and technical performance of your site. With this data, you can see if there is room for improvement or if there are pain points for a specific area or specific audience of your site. These metrics work differently than many of the metrics in Google Analytics, so it’s also important to understand what they represent and how they are collected.
These are a little technical and deal with how sites are loaded from backend to your device, but it makes much more sense when it is in a timeline to see how it all fits together. The W3C specifications have a technical graph on these processes here.
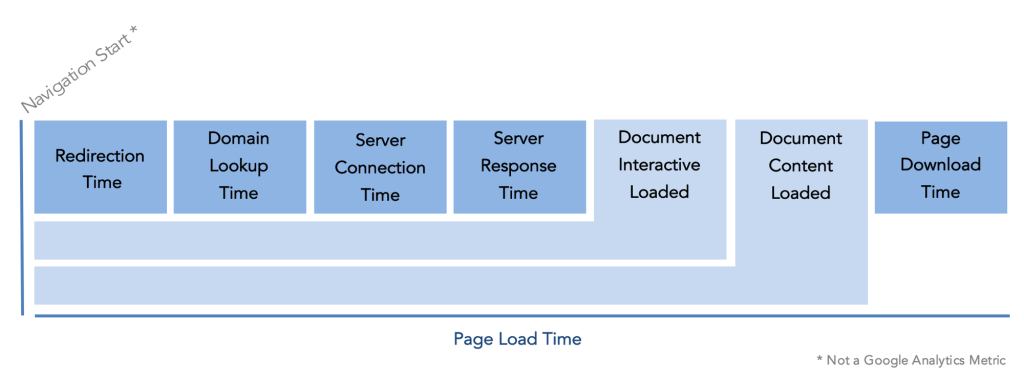
For our purposes, here is a very simplified timeline using the Google Analytics metrics’ names. It shows what happens as a page loads. The boxes represent steps and aren’t sized according to how much relative time each takes.

Below are the metrics in the order that they happen:
Avg. Page Load Time
This is average the time, in seconds, it takes the page to load. It begins when the navigation begins (ie. clicking on a link) and ends when the webpage has completed loading in the user’s browser. This metric will always be the largest because it will include the whole timeline. If you have a high page load time, don’t immediately assume it is because of content on your site. Since it includes all steps, the longer time may be from redirects, server-side calls, or a user’s location and network connection.
Avg. Redirection Time
If there are redirects, this will show the time is takes for redirects to start and end. If there aren’t any, there will be a 0 for this metric.
Avg. Domain Lookup Time
This is the part of the timeline where the user’s browser searches for the IP address (domain) of your site. This happens before your site loads and will be longer if your content is coming from multiple domains. Domain Lookup Time is also valuable if you are switching web hosts or if you just started a new hosting solution to see if it affects this metric.
Avg. Server Connection Time
Along with the previous metric, this one should be the shortest amount of time. After the domain lookup is complete, the server will connect the domain’s IP address with your device’s IP address.
Avg. Server Response Time
This is the average amount of time, in seconds, that it takes for your site’s server to respond to what a user is doing on your site such as clicking through pages and loading content. The user’s location and network will matter for this metric.
Avg. Document Interactive Time
Now we’re getting to the actual content of the page! Document interactive time is when the page is still loading, but the user can begin to interact with the page. This metric measures the mount of time, in seconds, it takes to get to this interactive point from the start of the timeline.
Avg. Document Content Loaded Time
Average Document Content Loaded Time is when everything in the DOM has finished loading. This also takes into account the whole timeline up to this point. Therefore, it will always be greater that the document interactive time. If you are familiar with jQuery, this corresponds to onready().
Avg. Page Download Time
Average Page Download Time will always be less than Avg. Page Load time because it represents a portion of the total page load. At this point in our timeline, the HTML (DOM) of the page has finished loading but we still need other elements to load like images, stylesheets or other things that are referenced from the page. This does not measure the whole timeline up to this point, only the time from the completion of the HTML being loaded.
The Data Collection
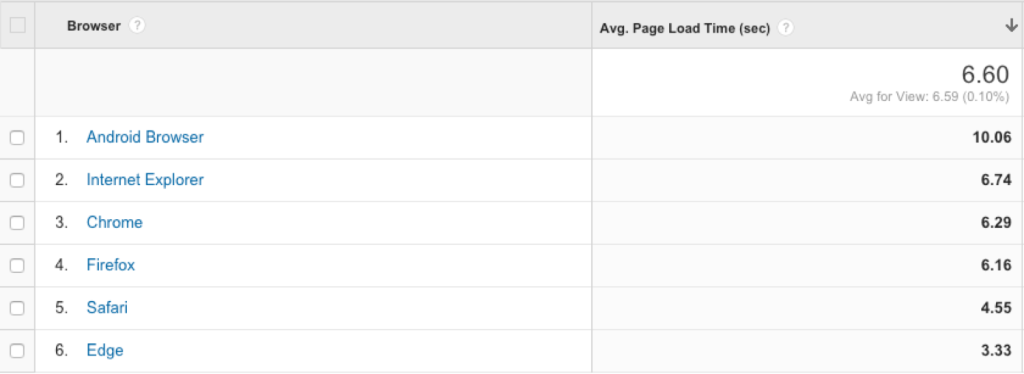
Timing metrics are based on a 1% sample of your data by default. To understand the impact of this, it’s useful to pair timing metrics with the metrics representing the sample size. For example, I created a custom report where I wanted to see how my average page load time compared on different browsers.

Wow, it looks like Android Browsers are having a hard time loading my pages. But is it fair to say that my site isn’t optimized for Android Browsers? Here is the same report with the metric Page Load Sample added:

Page Load Sample tells how many pages were used to track the Average Page Load Time. Now we can see that we don’t need to panic because the 10 second load time only represents 7 pages. We can ask our developers to do a little more testing to see if the site isn’t optimized for Android Browsers, but it may be that other factors affected the load time. Overall, data from 7 pages is not enough to gain any valuable insight.
There is an option to potentially increase this sample size, by altering your Google Tag Manager settings or tracking code. However, keep in mind that no matter how high you set it, it will be sampled at a maximum of 1% or 10,000 of the pageviews collected on the property level, whichever is higher. So if your site has over 1 million pageviews per day, the maximum will be 1%.
Use These!
Even if you don’t come from a technical background, you should feel confident in using these metrics and reporting on your site’s speed. You can analyze these in the standard Site Speed reports or create custom reports and dashboards to monitor these measures over time. You may find some surprising insights when you pair them with other metrics and dimensions, so experiment!
These reports are great to set up with weekly or monthly automatic emails to the website owner, whether that’s yourself or developers with whom you collaborate. You may even be inspired to use site speed in your conversion tests.


