3 More Tips For A Stable Google Tag Manager Migration
With the anniversary of Google Tag Manager’s public release on October 1st (Happy 3rd Birthday!), the recent V2 upgrade and the new features that are continually being released, maybe we’ve finally convinced you to switch all of your tracking and tags to Google Tag Manager.
We have an invaluable guide to safely migrating from on-page tracking by Dan Wilkerson that outlines the steps and code changes that are necessary for a safe migration (a must-read). But what if these steps are out of your control?
It’s common that the changes are made by a third-party vendor, consultant or separate technical team. Other than checking the code itself, how can you be sure that your migration is air-tight and that you have continuous data when you’re not the one actually making the change?
If you find yourself in that position, here are 3 tips to gain more control and confidence during the migration process.
1. Create a Benchmark Report
One of the cardinal sins of migrating to a tag management system is just ‘flipping the switch’ and immediately sending Tag Manager pageviews and hits to your main property. This is a bad idea for two main reasons:
- If the on-page analytics code hasn’t been removed, you will get duplicate pageviews. Your boss may be happy to see numbers increase, but it will be completely inaccurate.
- You may lose vital tracking if you had virtual pageviews set-up or custom on-page code configuration that affected how pageviews were sent. When you work with a large site, it is difficult to account for every pageview configuration, event and hit that might be different for specific sections or page templates.
As outlined in previous posts, the safe way to start the migration process is to create a test property to send the Tag Manager hits to and compare it to your historical property. The test property will ideally have all of the same Google Analytics settings and filters so you can be sure that any discrepancies are on the data collection side instead of the data processing side.
The best way I’ve found to benchmark this data is through external reporting such as Google Sheets to compare the properties’ data side-by-side and in the same timelines.
First, open a Google Sheets document in the browser that you are signed into Google Analytics. Under the ‘Add-ons’ top menu item, select ‘Get Add-Ons’ and download the Google Analytics Add-On.
Once you have the tool, you can use it right from the top menu and navigate to Add-ons > Google Analytics > Create New Report. When starting the report, it’s best to compare data from the highest level first. So your first group of metrics can be pageviews, sessions, users and bounce rate with no filters or segments added. You can add ‘date’ as the dimension as well, since it will help in creating a chart.
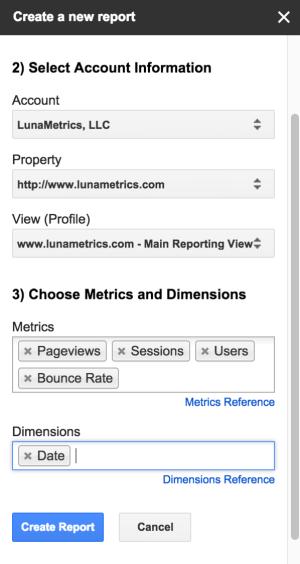
Once the report is created for the production reporting view, duplicate the report for the test view that is tracking with Google Tag Manager. For this initial comparison, your configuration page should look like below:
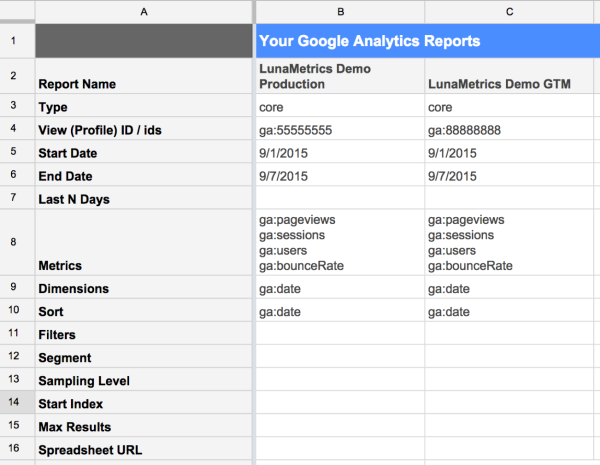
When you run the report, two tabs will be added with the data from Google Analytics. You can then add another tab for your comparison. The benefit is that you can see the metrics next to each other and calculate the percent difference between them.
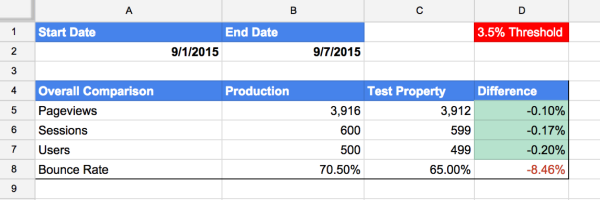
So now we can see that our overall metrics look like they are lining up, but our bounce rate is off. Maybe we should go into Tag Manager and make sure that there aren’t extra events or events that are set to interaction when they should be non-interaction.
Conditional formatting and charts can be added to make it a quick visual read as well. We can use the data by date to see how metrics are getting closer over time.
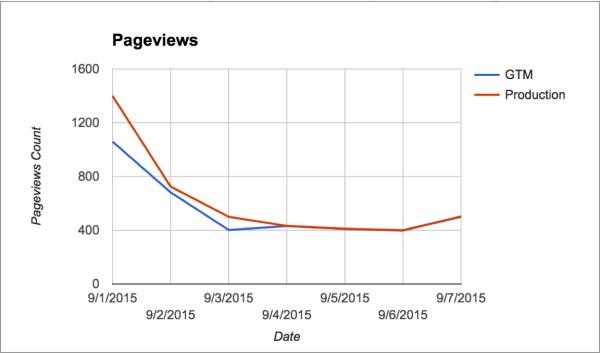
After analyzing the overall metrics, drill down and create reports by hostname (if tracking more than one domain), and the Page Path Level 1 dimension. This will let you know if certain sections of your site are causing the greatest difference in tracking. You can then meet with your vendor or developer to check on a specific area of the site before migrating.
There area always going to be differences, so don’t get hung up on exact numbers. Internally, we typically get to a 0-3% in hits between the test property and production property before migrating the production data to Tag Manager. (Ecommerce data should be 100% correct though!)
2. Create a Custom Dimension for Tag Manager Hits
When it’s time to migrate, the next step is removing the on-page legacy code and collecting all hits through Tag Manager. This may sound easy, but I’ve personally seen sites that have a few forgotten pages or sections that still have the legacy code (and even legacy, legacy code from Urchin!).
It might not create a noticeable variance in overall metrics, but it could create problems for those pages involving duplicate hits, configuring content groups through Tag Manager and other pageview settings. Plus, we want the data to be as accurate and precise as possible.
You can catch any hits that are coming into your production property that aren’t from your Tag Manager account in a separate view. The first step is to create a custom dimension by adding it to Google Analytics:
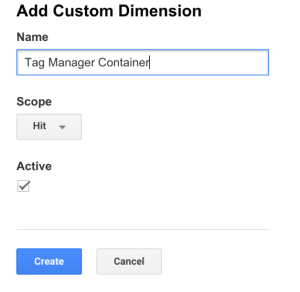
Then, add the dimension to your pageview and event tags with the value of {{Container ID}}. This variable is available automatically under ‘Utilities’ in Tag Manager.

Next, create a new view with a filter that excludes all hits from your Google Tag Manager container. Now you can isolate instances where any tracking other than Tag Manager is making its way into your production property.
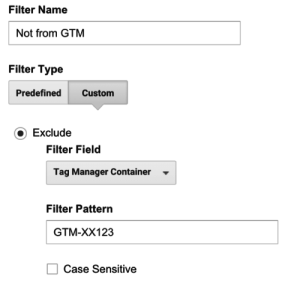
This view will also pick up any ghost referral spam coming into your site, so make sure you couple it with a hostname filter!
3. Crawl Your Site
The method above is good for detecting sections that still have legacy code but not Tag Manager code. However, how would you know if legacy code was removed but not replaced with the correct Tag Manager code on some pages? You might see a decrease in metrics, but it would be difficult to determine which pages were missing from Google Analytics that usually track, especially if they are pages that aren’t accessed as much.
A great practice is to use a crawler tool to check your site to confirm that all pages have your Tag Manager code. The example tool I will use is a paid version of Screaming Frog, but there are many others available. These tools are usually used for SEO purposes to check pages for keywords, but we can use it to check for the GTM ID as well. If you have a crawler, create a custom filter to list pages that do not contain the GTM ID.
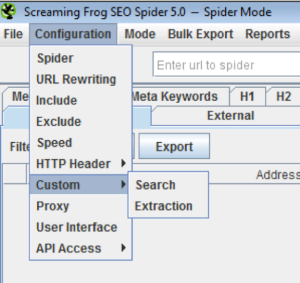
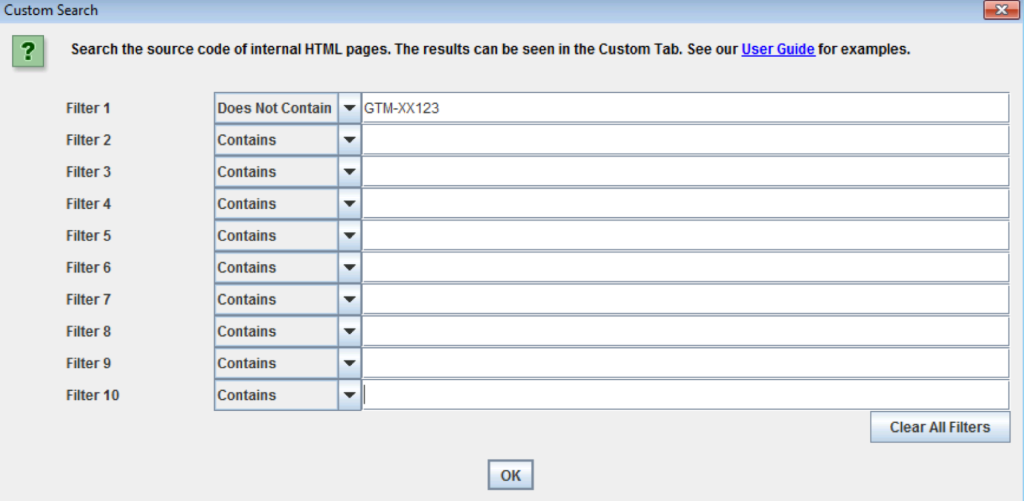
This will give you an exportable table of the URLs on your domain or site section that are missing Tag Manager code. This step is appropriate for all analysts, not just those using Google Tag Manager or those in the midst of a migration. You can follow the steps above and set the filter to look for pages that don’t have your property ID (i.e., UA-12345-1) if you are not using Tag Manager yet.
Even if you’re not a part of the technical and on-page changes during a migration, these steps will ensure that you are informed and involved in the smooth transition toward continuous, accurate data.


