Google Analytics Users: Two Calculations

“Users” is easily one of the most frequently used metrics in Google Analytics. We love it because it gives us information that spans multiple sessions. However, as you’ll see below – it’s also one of the most misunderstood metrics, with significant measurement and reporting challenges.
How Well Do You Know the Users Metric?
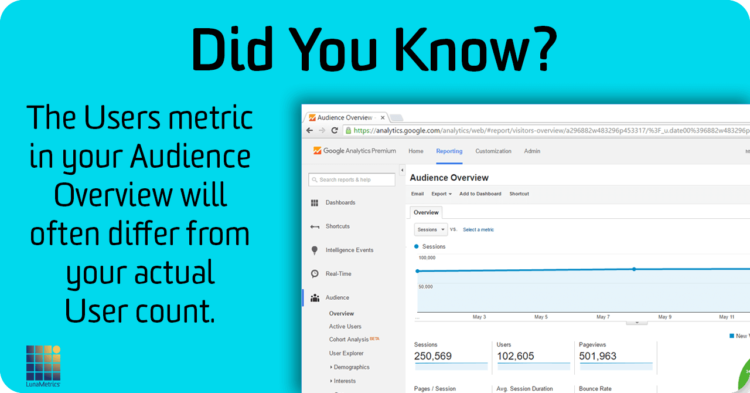
Contrary to popular belief, the Users metric in standard Google Analytics views doesn’t really represent individual users and people. Rather, this number is based on a cookie that is set by the user’s browser. That means if you access the website from a different browser or device, you might be counted as multiple users.
This cookie allows us to see how frequently users come back to the site, whether it takes multiple sessions to convert, and even lets us set custom information to our users with custom dimensions like persona or prospective lead. Amanda Schroeder gives great examples on defining audiences this way.
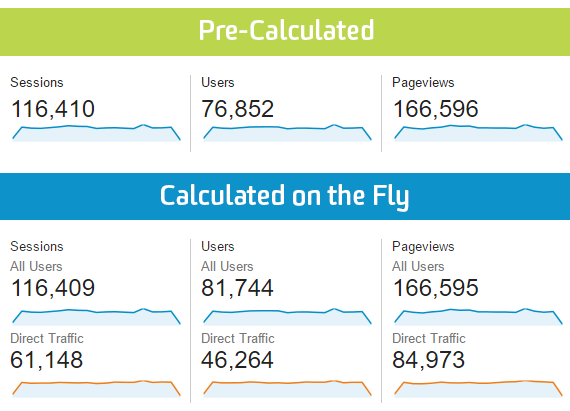
To find how many users came to your site within a timeframe, the typical way to get this metric is to go to Audience > Overview. This is the quickest way to answer that question and because it is a standard report, it is unsampled no matter how many sessions were in the timeframe. But watch out – notice that if you add any segment in addition to All Sessions, the User metric for All Sessions will change.
The reason for this difference isn’t a bug, it’s due to the two different ways users are calculated by Google Analytics.
I’ll get more specific on where this difference could be a hazard by causing large inaccuracies.
Behind the Scenes
When you open Google Analytics, you’re immediately looking at a standard report. Any of the reports in the left-hand navigation is a standard report as well. These reports are dimensions, metrics, and graphs that are predefined by Google Analytics and answer a wide variety of questions.
The standard reports in Google Analytics are unsampled because they are based on tables that have already been added together by date (so no calculation has to be done). If I am looking at one day’s data and change the date to add another day, metrics from Day 1 are added to Day 2 and those numbers are what we see in the standard report.
For pageviews and sessions, this number is as accurate as it can be because neither metric can span multiple days (sessions time out at midnight according to the View’s timezone). The users metric is more complex because some of Day 1 users may be Day 2 users as well, so the numbers can’t just be added together. So, Google Analytics relies on the following calculation methods.
Pre-Calculated
To provide the Users metric in the Audience Overview standard report, additional data is added to the table. The new information includes the number of sessions and what time each session occurred (based on the user’s browser in this case).
So if you’re looking at your Audience Overview report, the number of users you see listed has been calculated ahead of time and was ready as soon as you loaded the report.
Calculated on the Fly
This second method in which users are calculated skips the pre-aggregated tables completely and goes back to the raw, unprocessed data. This calculation is based on a much larger set of data, which makes it more accurate. Because there’s more data, this also explains why ad-hoc reports are prone to sampling and generally take longer.
It should start to make sense why the users metric changes when a new segment is added (and thus calculated on-the-fly). The total difference may range from a few hundred to a few million depending on the volume. Note that these user calculations are true for Google Analytics 360 (Premium) as well.
Even though the users metric may change by hundreds or even thousands, the difference will typically only be around 1%. The hazard is when you start to analyze filtered views. Since those pre-aggregated, unsampled tables are property-level, things get more complex and more prone to inaccuracy the more filtered a view is. This certainly affects high-volume sites.
Websites that see hundreds of millions of hits per month are just like any website when it comes to analytics- there’s a lot to be learned from looking at granular views. For example, views can be focused on very specific content areas, traffic sources or geography. This will also affect faux-Roll-Up properties that have several websites using the same tracking ID but split into many views. We have seen that in views that focus on 1-2% of hits, which still may be in the millions, the pre-calculated users metric can be off by up to 25-30%.

Example of Different User Calculations. Users in this view shown in the default Audience Overview report, and then with a Segment added.
What To Do
For views that use most of the data in the property, this isn’t a huge deal (but I hope it’s still useful to know why the numbers are different!). However, for views that are based on 10% or less of the total hits in the property, it’s worth imagining a tiny asterisk next to the users metric in the standard report.
If you have the standard version of Google Analytics, it is best to analyze users in the broadest view you have in the Audience Overview with a segment applied. You can also pull a custom report including the users metric, but custom reports and segments may be sampled depending on how many sessions are in the date range. Just note that the shorter the date range, the less sampling there will be.
For Google Analytics 360 (Premium) customers, the most accurate method to report on users in a view is to pull an unsampled report in Google Analytics Premium. This can be exported right from the Audience Overview and is accurate because it uses the second method of calculation mentioned above and there will not be sampling, so the report will be based on 100% of sessions.


