Using Google Analytics Measurement Protocol With Webhooks
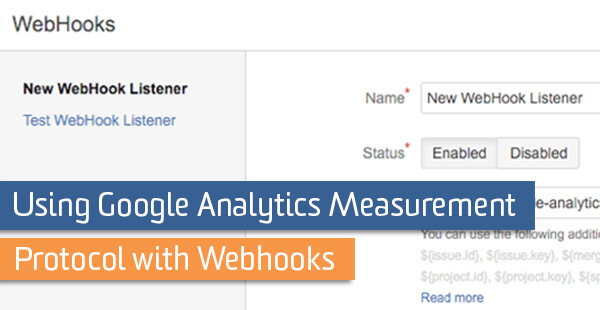
Like most LunaMetricians and analysts in general, I’m a huge fan of automation. Working on account administration and implementing web tracking should be as efficient as possible so that more time can be spent on the valuable analyses that come after. Google provides API solutions for the majority of implementation, managing accounts and reporting (check out the new version released recently) but there are some features that are still currently unavailable like annotations.
Enter the Webhook. For this post, I’m going to focus on the specific integration of automatic events from JIRA, a software development tool from Atlassian; however, most of this process relies on what are called webhooks which many project management platforms are beginning to adopt. Search to see if your platform or suite has this capability and read on.
Other popular workflows that use webhooks:
- GitHub
- Zendesk
- Bamboo v.3 (in beta)
- Pingdom
We’ll use a webhook listener to wait for a specific action or step in a workflow, and then send specific information to our Google Analytics account.
“Annotations”
Annotating reports seems like it is an under-used feature that many would benefit from using. Adding notes to specific dates allows you to analyze possible site or audience impact of actions that aren’t necessarily tracked automatically. Some examples include:
- Staff changes
- Filter/event/tracking edits
- Specific start date of campaign (online and offline)
- Site development changes and pushes
It is simple to add annotations to the interface via the overall timelines in the standard reports or from the personal assets and shared tools menu under your view settings (pro-tip: use this second option to annotate future events). The problem arises when there is a need for multiple, reoccurring or bulk annotations to be used across many reporting views.
The reason I put this section in quotes is because we won’t technically be adding annotations, rather we will be adding events to be used as annotations. Why? Events can be automated and annotations can’t (yet). There are additional benefits to using events- you will be able to get a sense of the volume of changes over time in the events timeline, they will be available in all views (unless filtered by choice) and you can create custom alerts based off of them.
Strategy
There are connections that can be made from seeing this ‘behind-the-scenes’ data. For example:
- Ecommerce conversion rate declines after a code push to the mobile checkout (is there an error with the cart buttons or was tracking removed from some of these pages?)
- Maybe you work for an analytics agency and you notice a huge volume of code change event hits come in that relate to a site redesign (call the team and make sure events/goals/page tracking is still intact!)
- A bug is fixed on the billing form that has direct impact to both revenue and conversions
This method will be non-technical and requires zero coding or API use. If you have development experience or if you would like to have more control over the labels and behavior, Grant Kemp has a great post on using the Measurement Protocol with GitHub and JIRA. There is also a companion Ruby gem and open source project to check out too!
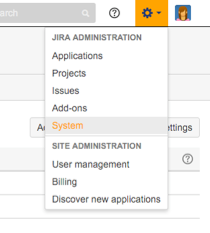
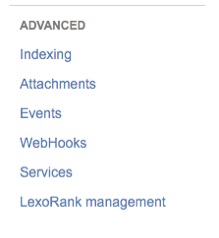
The first step is to find in our project management platform where we can add webhook listeners. Since this example uses JIRA, the option is under JIRA Administration > System > Advanced > Webhooks. If you do not have this option, make sure that your login has the appropriate privileges.
Once you see the option to create a new listener, notice that you have a field to enter a URL. In the screenshot below I have begun to construct a Google Analytics hit (I bet you can see where this is going!) There are also dynamic JIRA variables that I can use in the hit that are listed below the URL field – I’ll be adding these to my hit to pass as the event label.

To build out the event that we are sending, we don’t even have to manually type it out- we can use the Measurement Protocol Hit Builder. There, I can:
- Specify that it is an event hit using the dropdown
- Create a random client ID using the button
- Enter what I want the event category to show up as (‘ec’ parameter)
- What I want the event action to show up as (‘ea’ parameter)
We will hold off on the label for now and copy and paste the hit payload. (Note: you may also want to add domain if you want these events to show up in a filtered view that filters hits to only show your hostname).
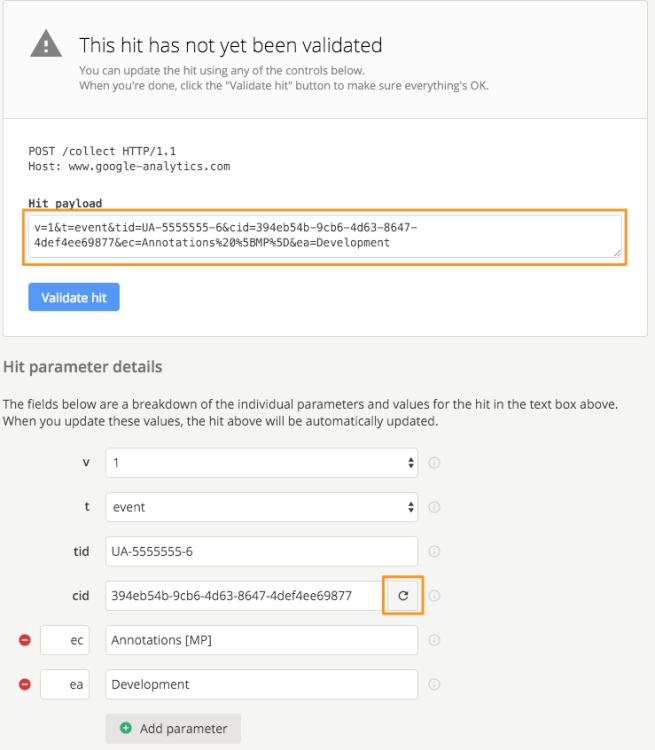
You can now copy and paste the payload to the webhook listener field after http://www.google-analytics.com/collect?. At the end of this string, you can add the event label with JIRA variables, such as ‘&el=${project.key}_${issue.id}’. The whole thing may looks something like this (the added event label is in orange:
http://www.google-analytics.com/collect?v=1&t=event&tid=UA-5555555-6&ci…;el=${project.key}_${issue.id}
After saving this, the only thing left to do is to tell JIRA when to send this hit. You or your project manager can add this to the workflow by choosing the ‘Add Post Function’ in the transition to Done.
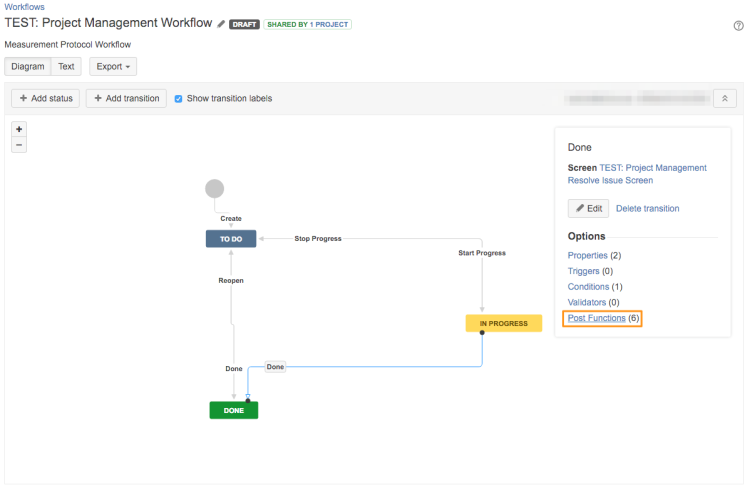
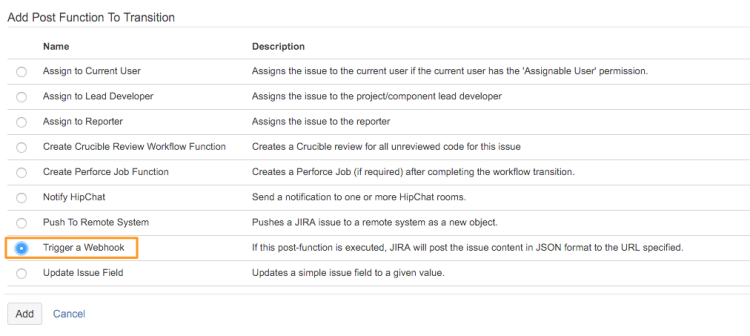
Now, anytime a ticket is marked as ‘Done’ with this JIRA workflow, an event hit will automatically be sent to Google Analytics. You can view it in your main reporting views (please read to the end if you decide to do this), or add view filters to only see it in specific views (again, to separate non-website hits from website hits). Below I used a custom report to view the event dimensions as a flat table.

Considerations
Using events as annotations does have its drawbacks. View filters can change the events moving forward (for example, changing ‘LUNANA-123’ in the Event Label to ‘LunaMetrics’), however since they are hits and data coming into your view, they can’t be changed after the event has been tracked and processed. Annotations also have the feature that they are viewable on all standard and custom reports, while the event dimensions and metrics would have to be added.
To see how your ‘Annotation’ events are affecting your web traffic, a side-by-side dashboard would be the solution, or a as a tab in a custom report. Overlaying the events on other timelines would currently require outside reporting like with Google Sheets.
This goes for everything in Google Analytics, but it is worth mentioning that clear labeling is important. A set-up I would choose is having the below structure:
Category: Annotations [MP]
Action: Development/ Design/ Marketing Etc.
Label: JIRA Project Key or ID / JIRA Ticket ID
It has to be apparent for anyone browsing the reports that these events are actions happening off of the website (the ‘[MP]’ is to clarify that they are Measurement Protocol hits).
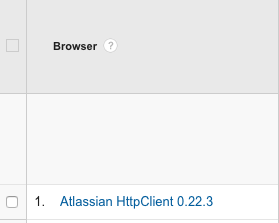
If you choose to include these hits in your main reporting view, please note that these event hits will not inflate pageview metrics but will count as sessions. Because there’s only one client id, these hits will all appear like they’re coming from the same user. These sessions will not have Landing Page (or other dimensions like language and geo-location fields) associated with them, so (not set) will appear. Although interestingly, both the Browser and Network dimension are set automatically in this case as coming from JIRA and are descriptive:
If you plan to have a significant volume of these Measurement Protocol hits, I highly recommend separating into a different view and using other reporting methods like Google Sheets, platforms you already use (Tableau, Domo, etc.) or soon Data Studio 360.
Ultimately, this exercise is a proof-of-concept to show a use of the Measurement Protocol that requires no coding or programming knowledge. As technologies like webhooks and other accessible API methods are developed and broadly adopted, I’m excited to see how this Google Analytics feature can expand and evolve into more use cases.


